You can send your data to Tableau with Catchr in 2 easy steps:
Download our Add-on for Tableau and place it in Tableau's desktop app file.
Creating a request on Catchr to import your data.
Download and install Tableau Desktop from this page.
Add a new Source on Catchr.
Our extension allows you to use a request built on Catchr on Tableau. This request will import data into Tableau, where you can work on the data and build a dashboard.
Download the extension:
Follow this link to our Google Drive and download catchr-data-connector.taco.
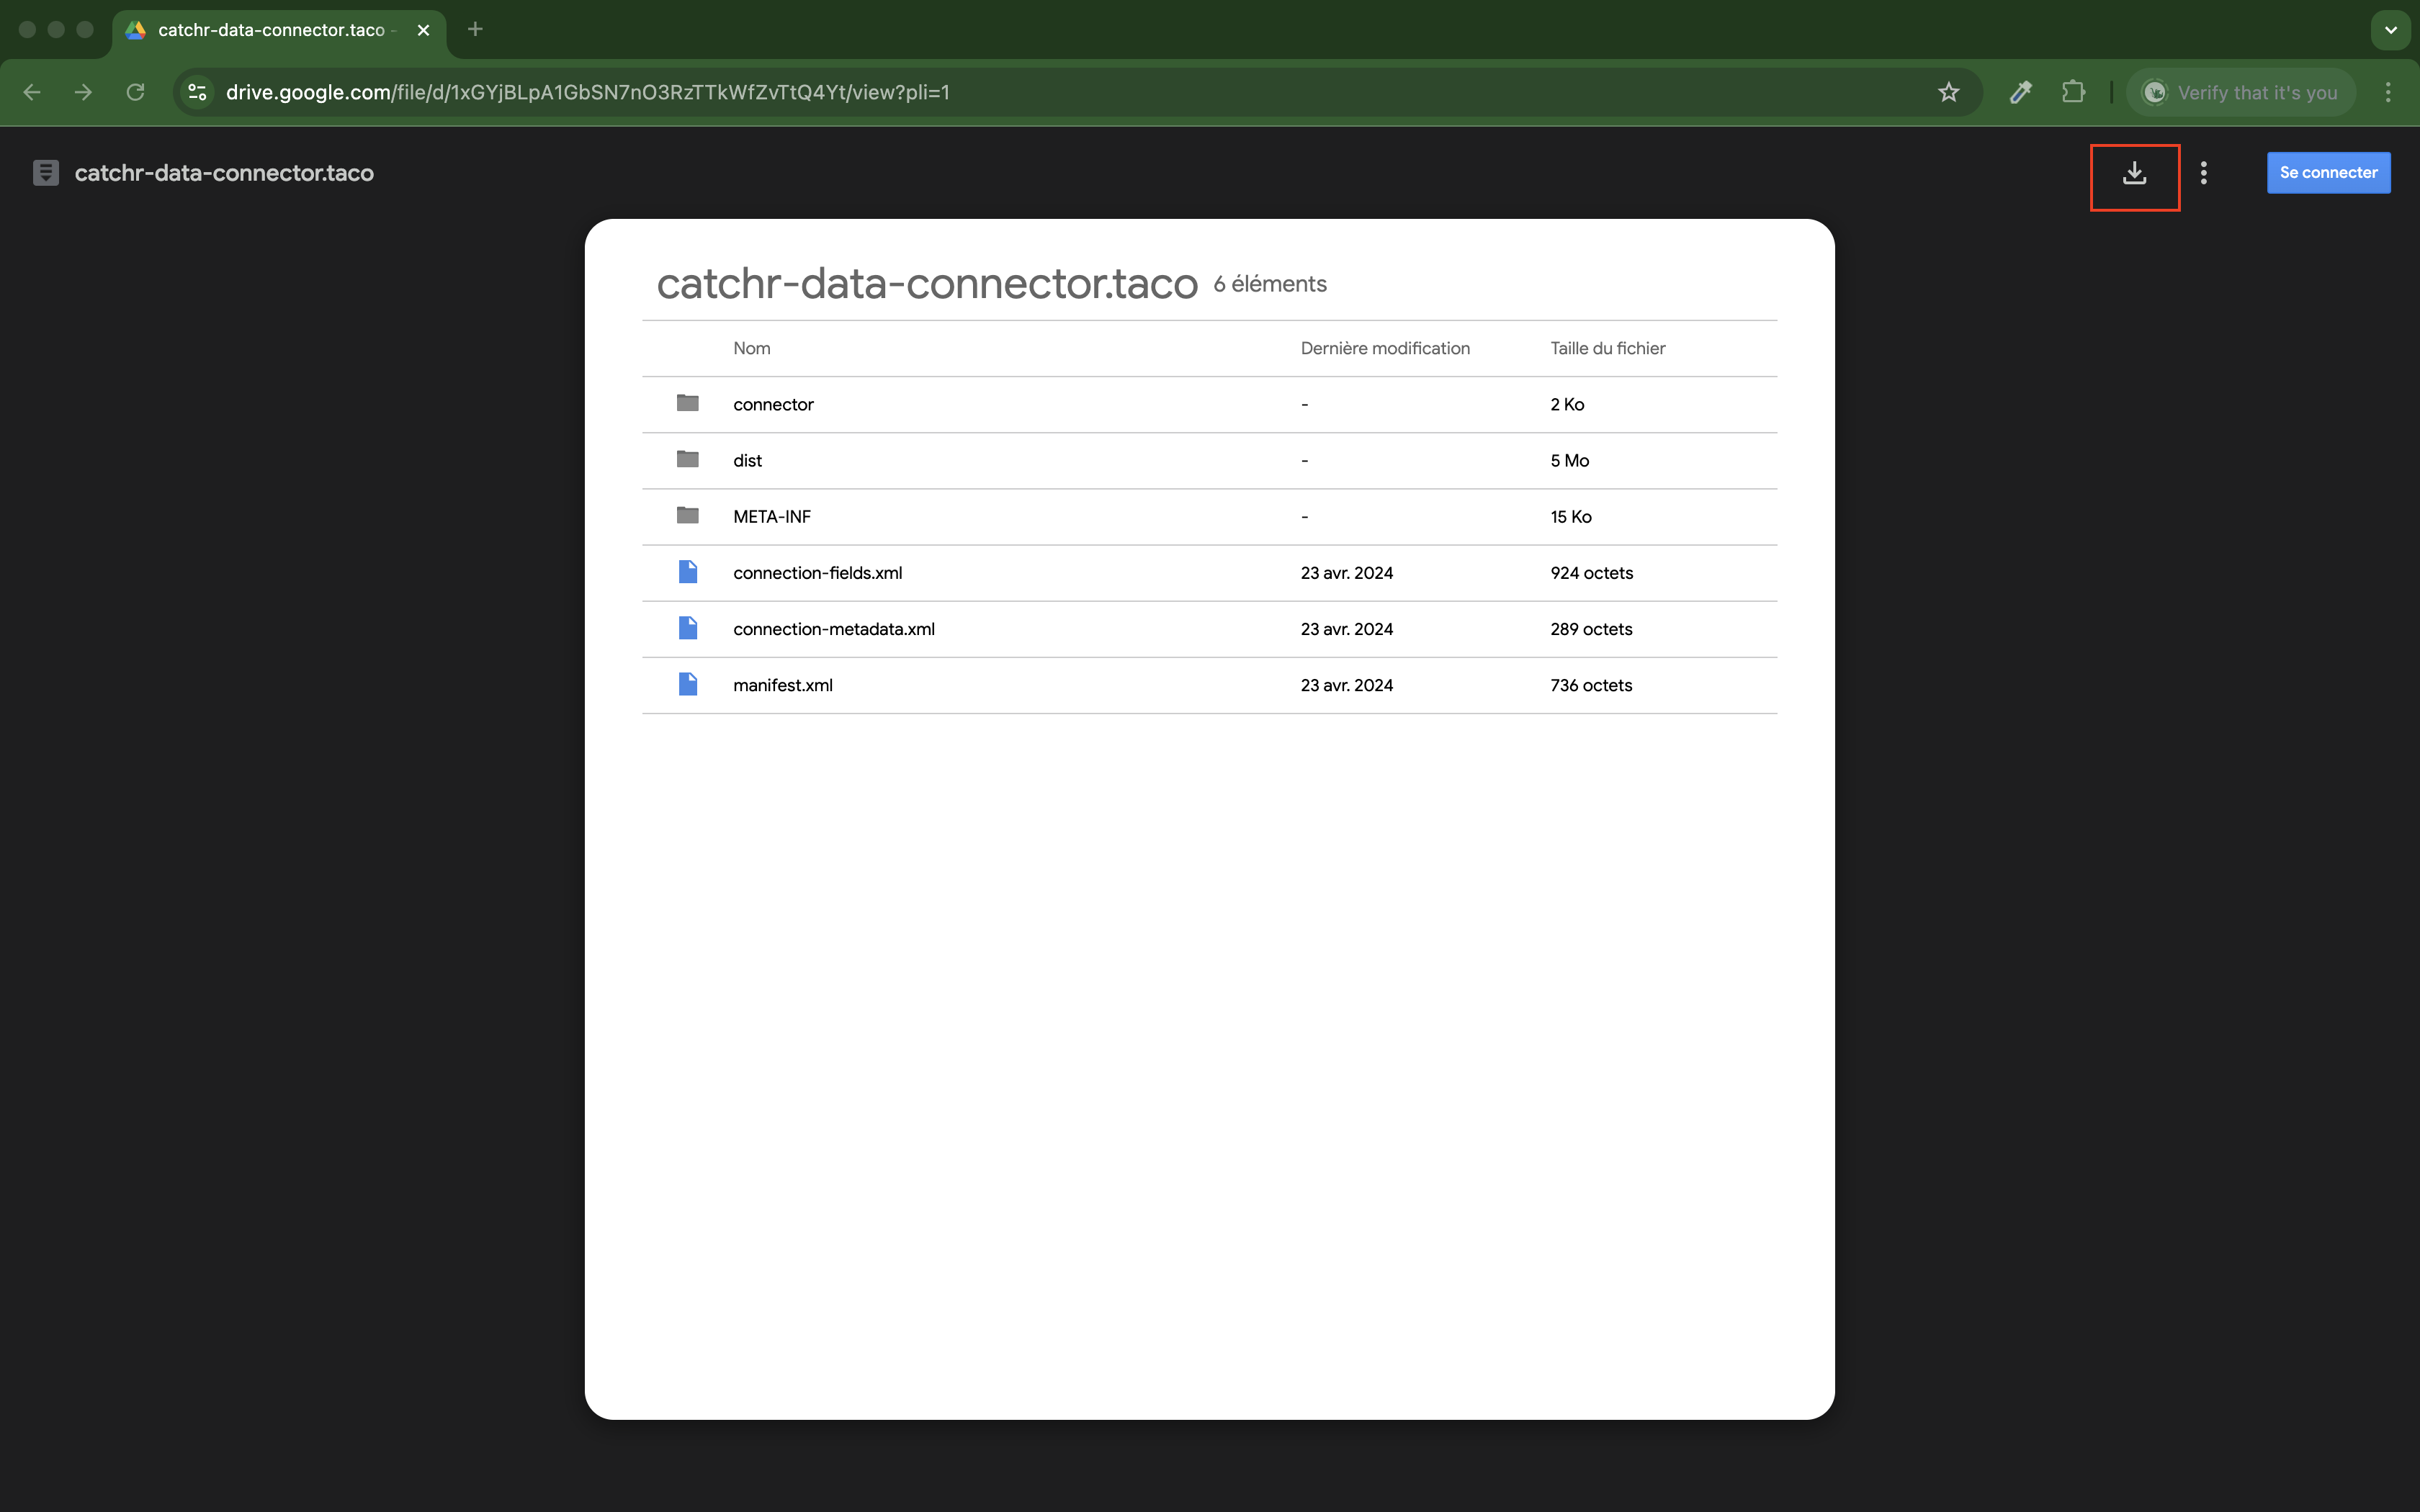
Copie catchr-data-connector.taco.
Place the .taco file in the following directory (default location):
For 2021.2 and newer:
For Tableau Desktop | For Tableau Prep Builder | For Tableau Server, Tableau Prep Conductor, Tableau Prep Flow Authoring |
|
|
|
For 2021.1 and older:
For Tableau Desktop | For Tableau Prep Builder | For Tableau Server, Tableau |
|
|
To enable your connector for Prep, you also need to add your taco to the following locations:
|
|
|
|
Once installed, the connector will appear in Tableau's list of connectors under Catchr - Data Connector par Catchr.
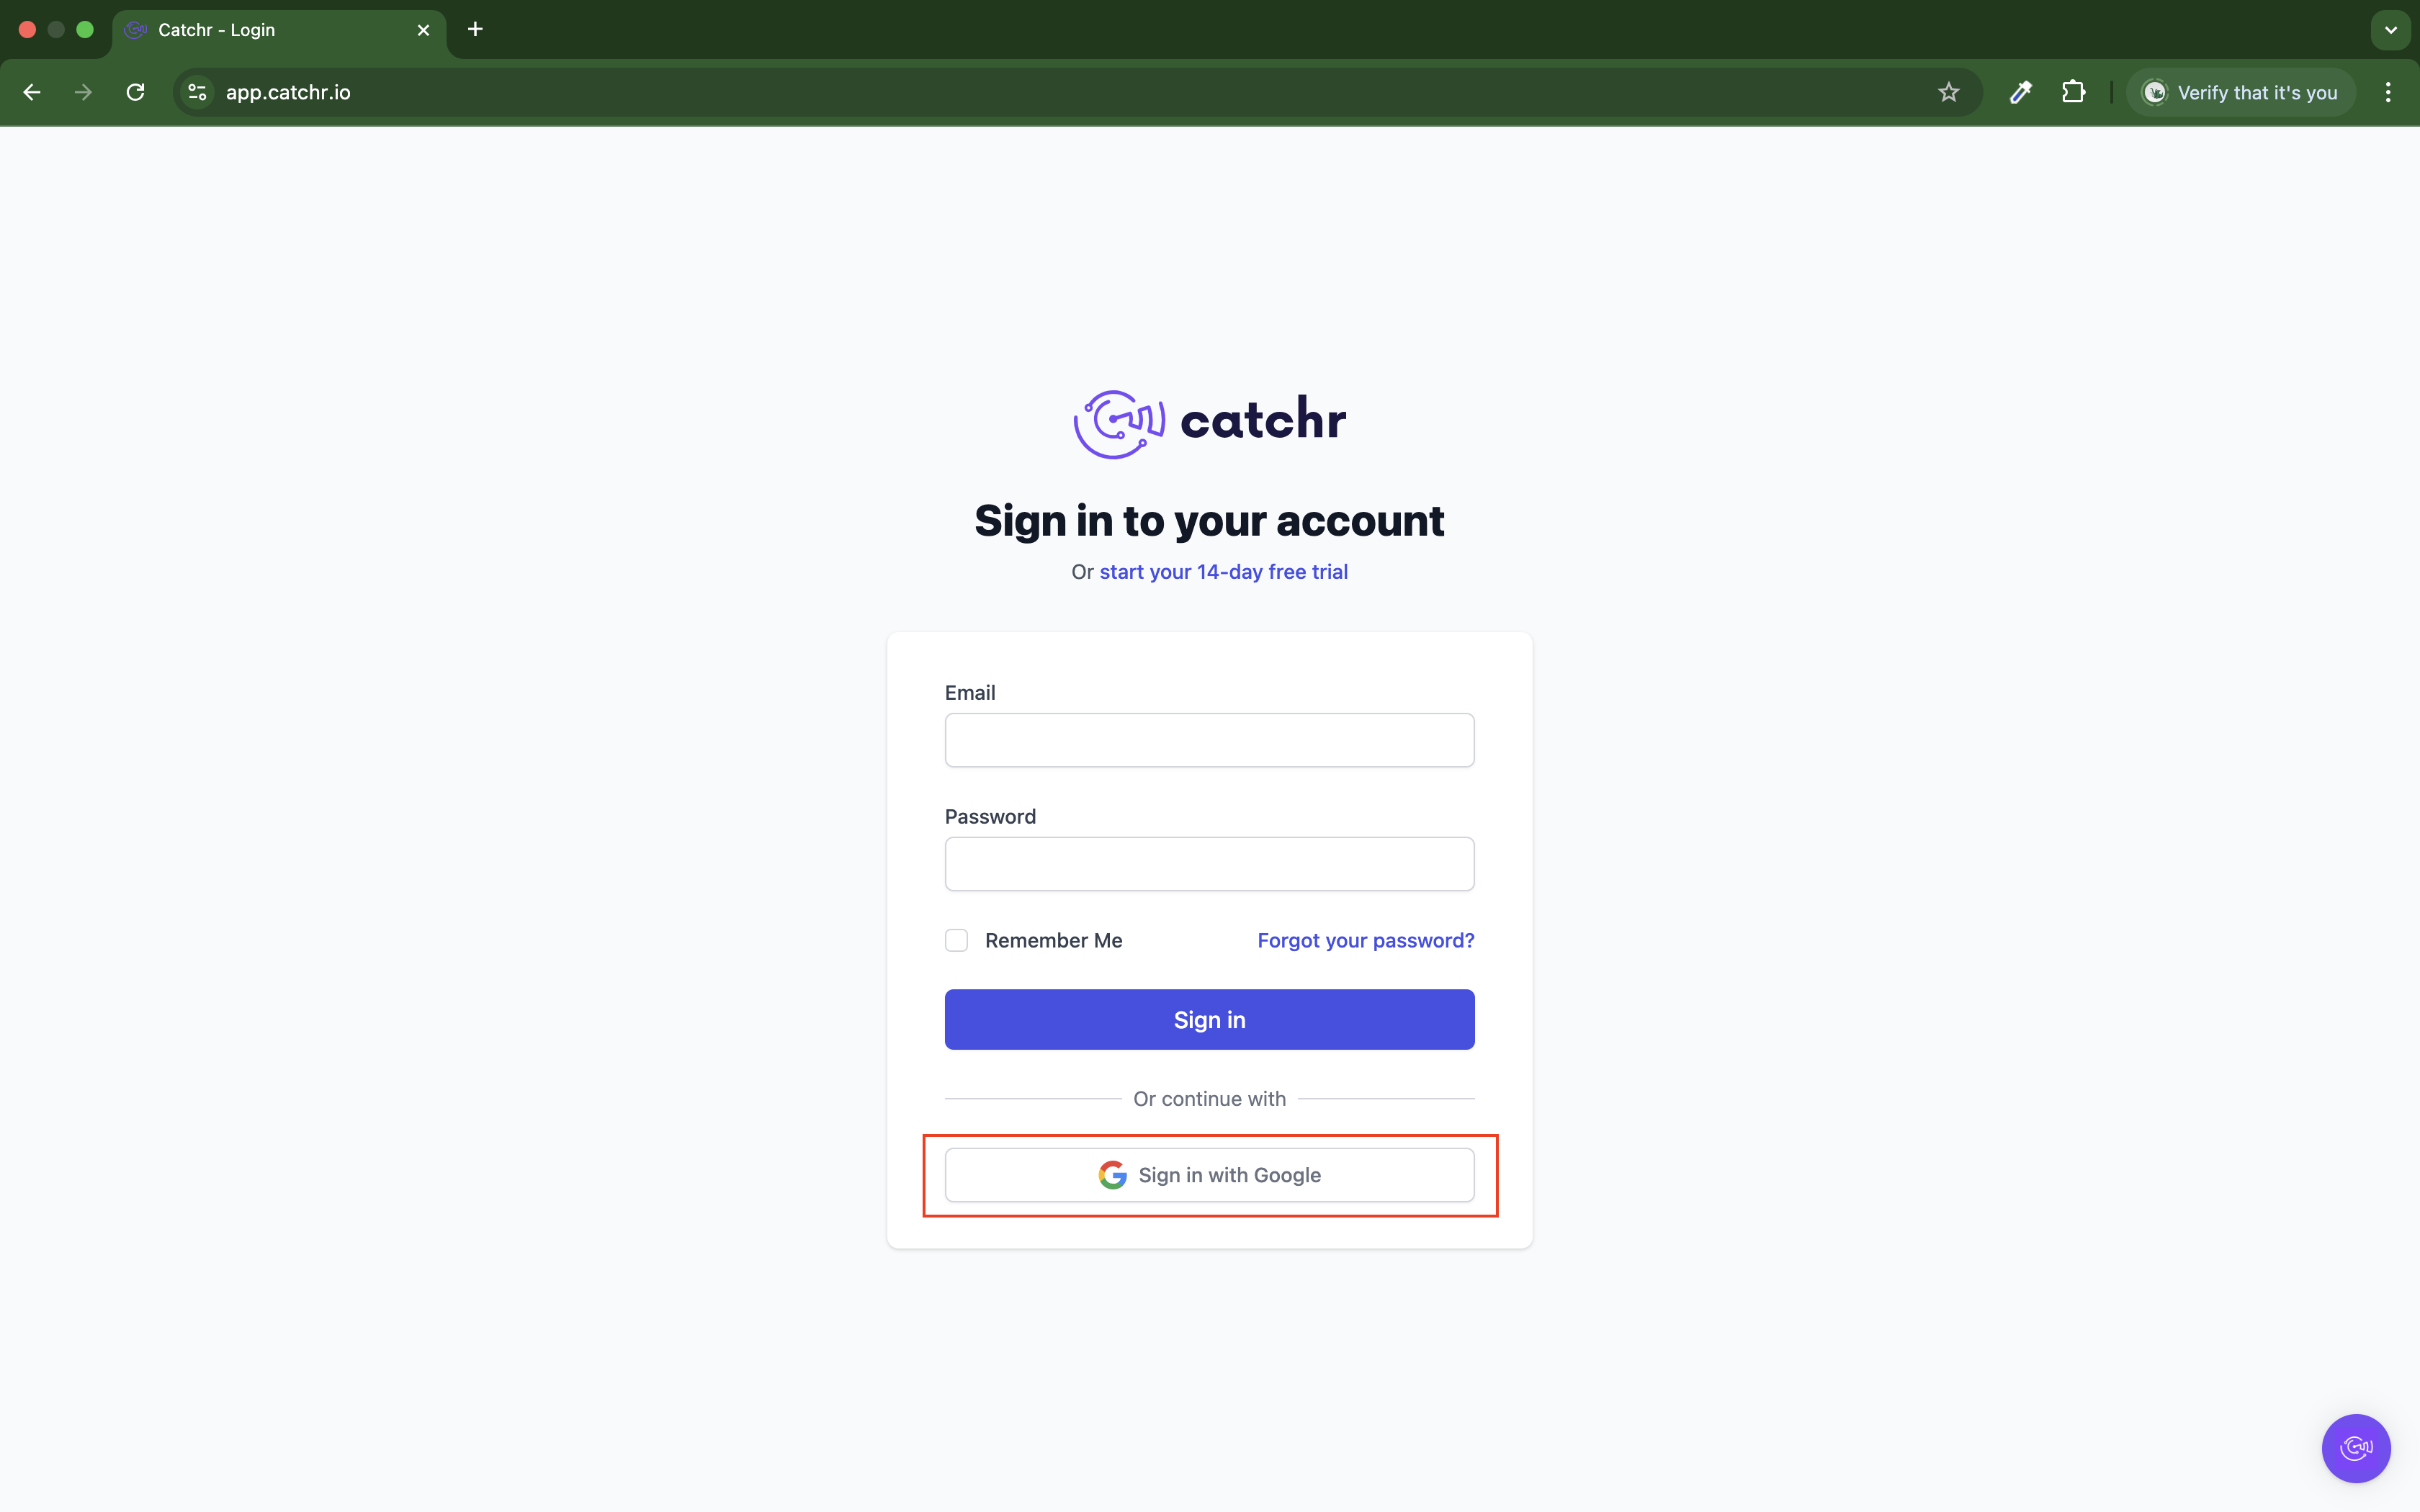
To begin, go to app.catchr.io and log in using your Google account by clicking the Sign in with Google button on the login page.
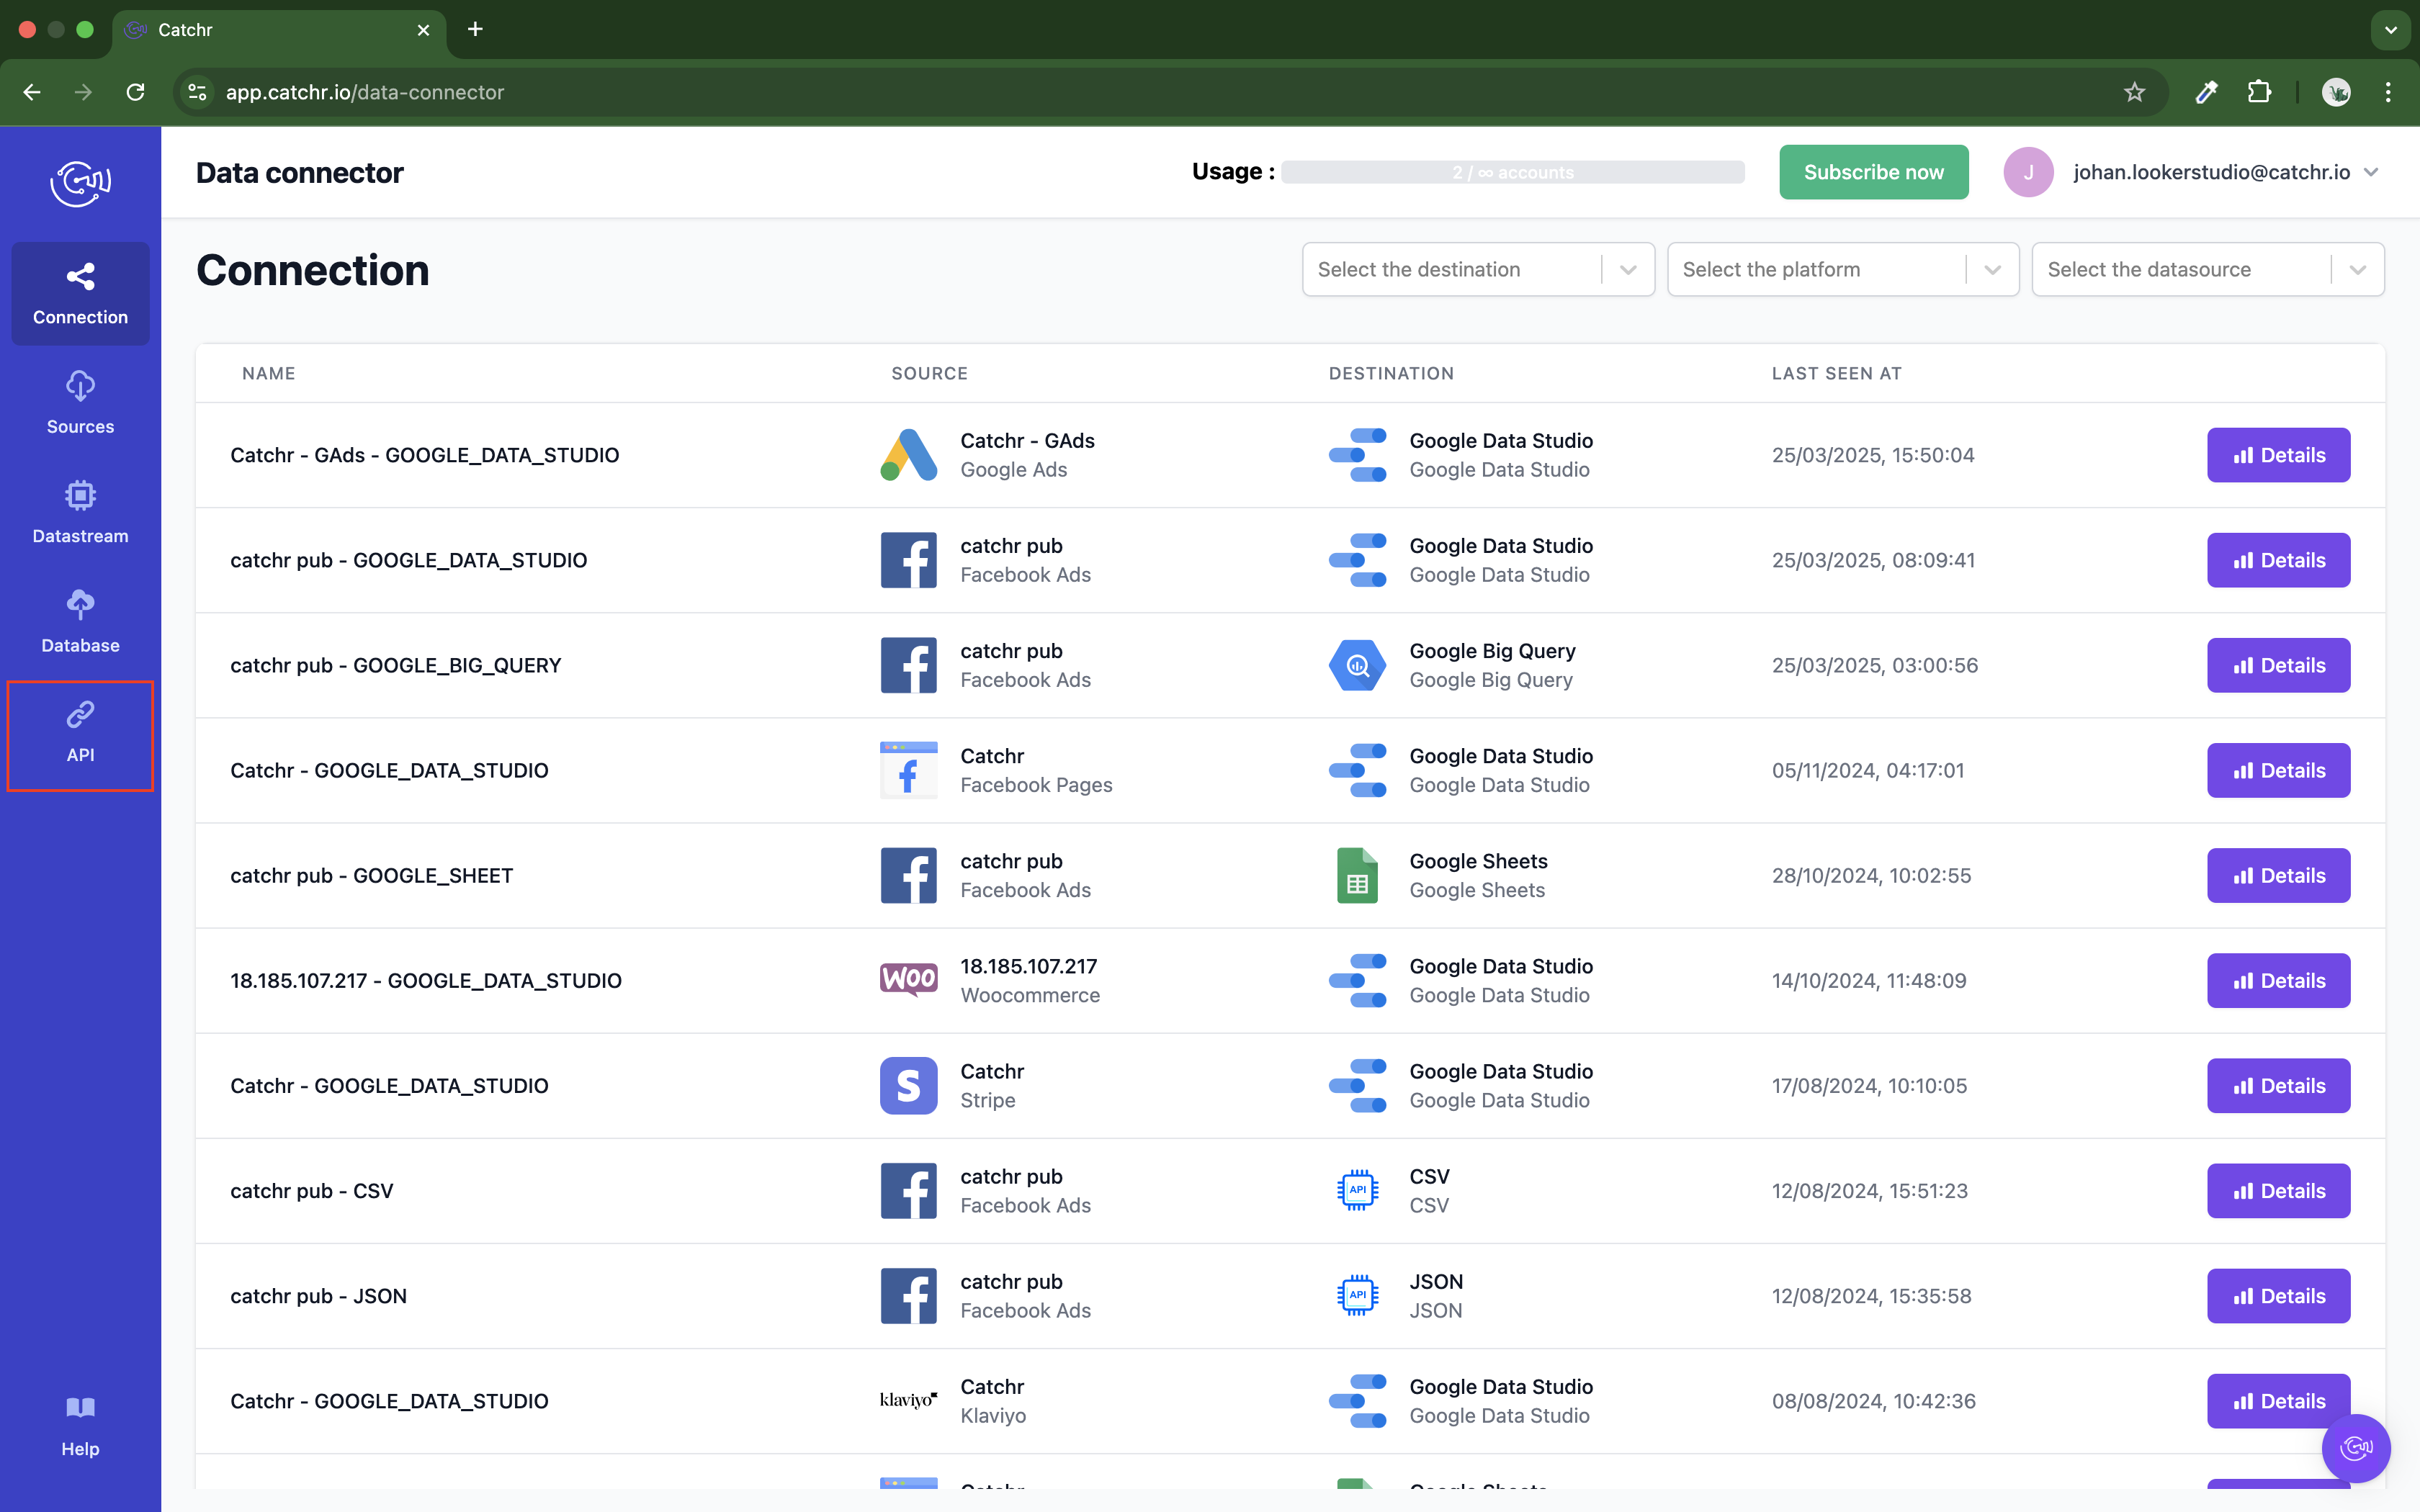
After logging in, navigate to the API section from the left menu.
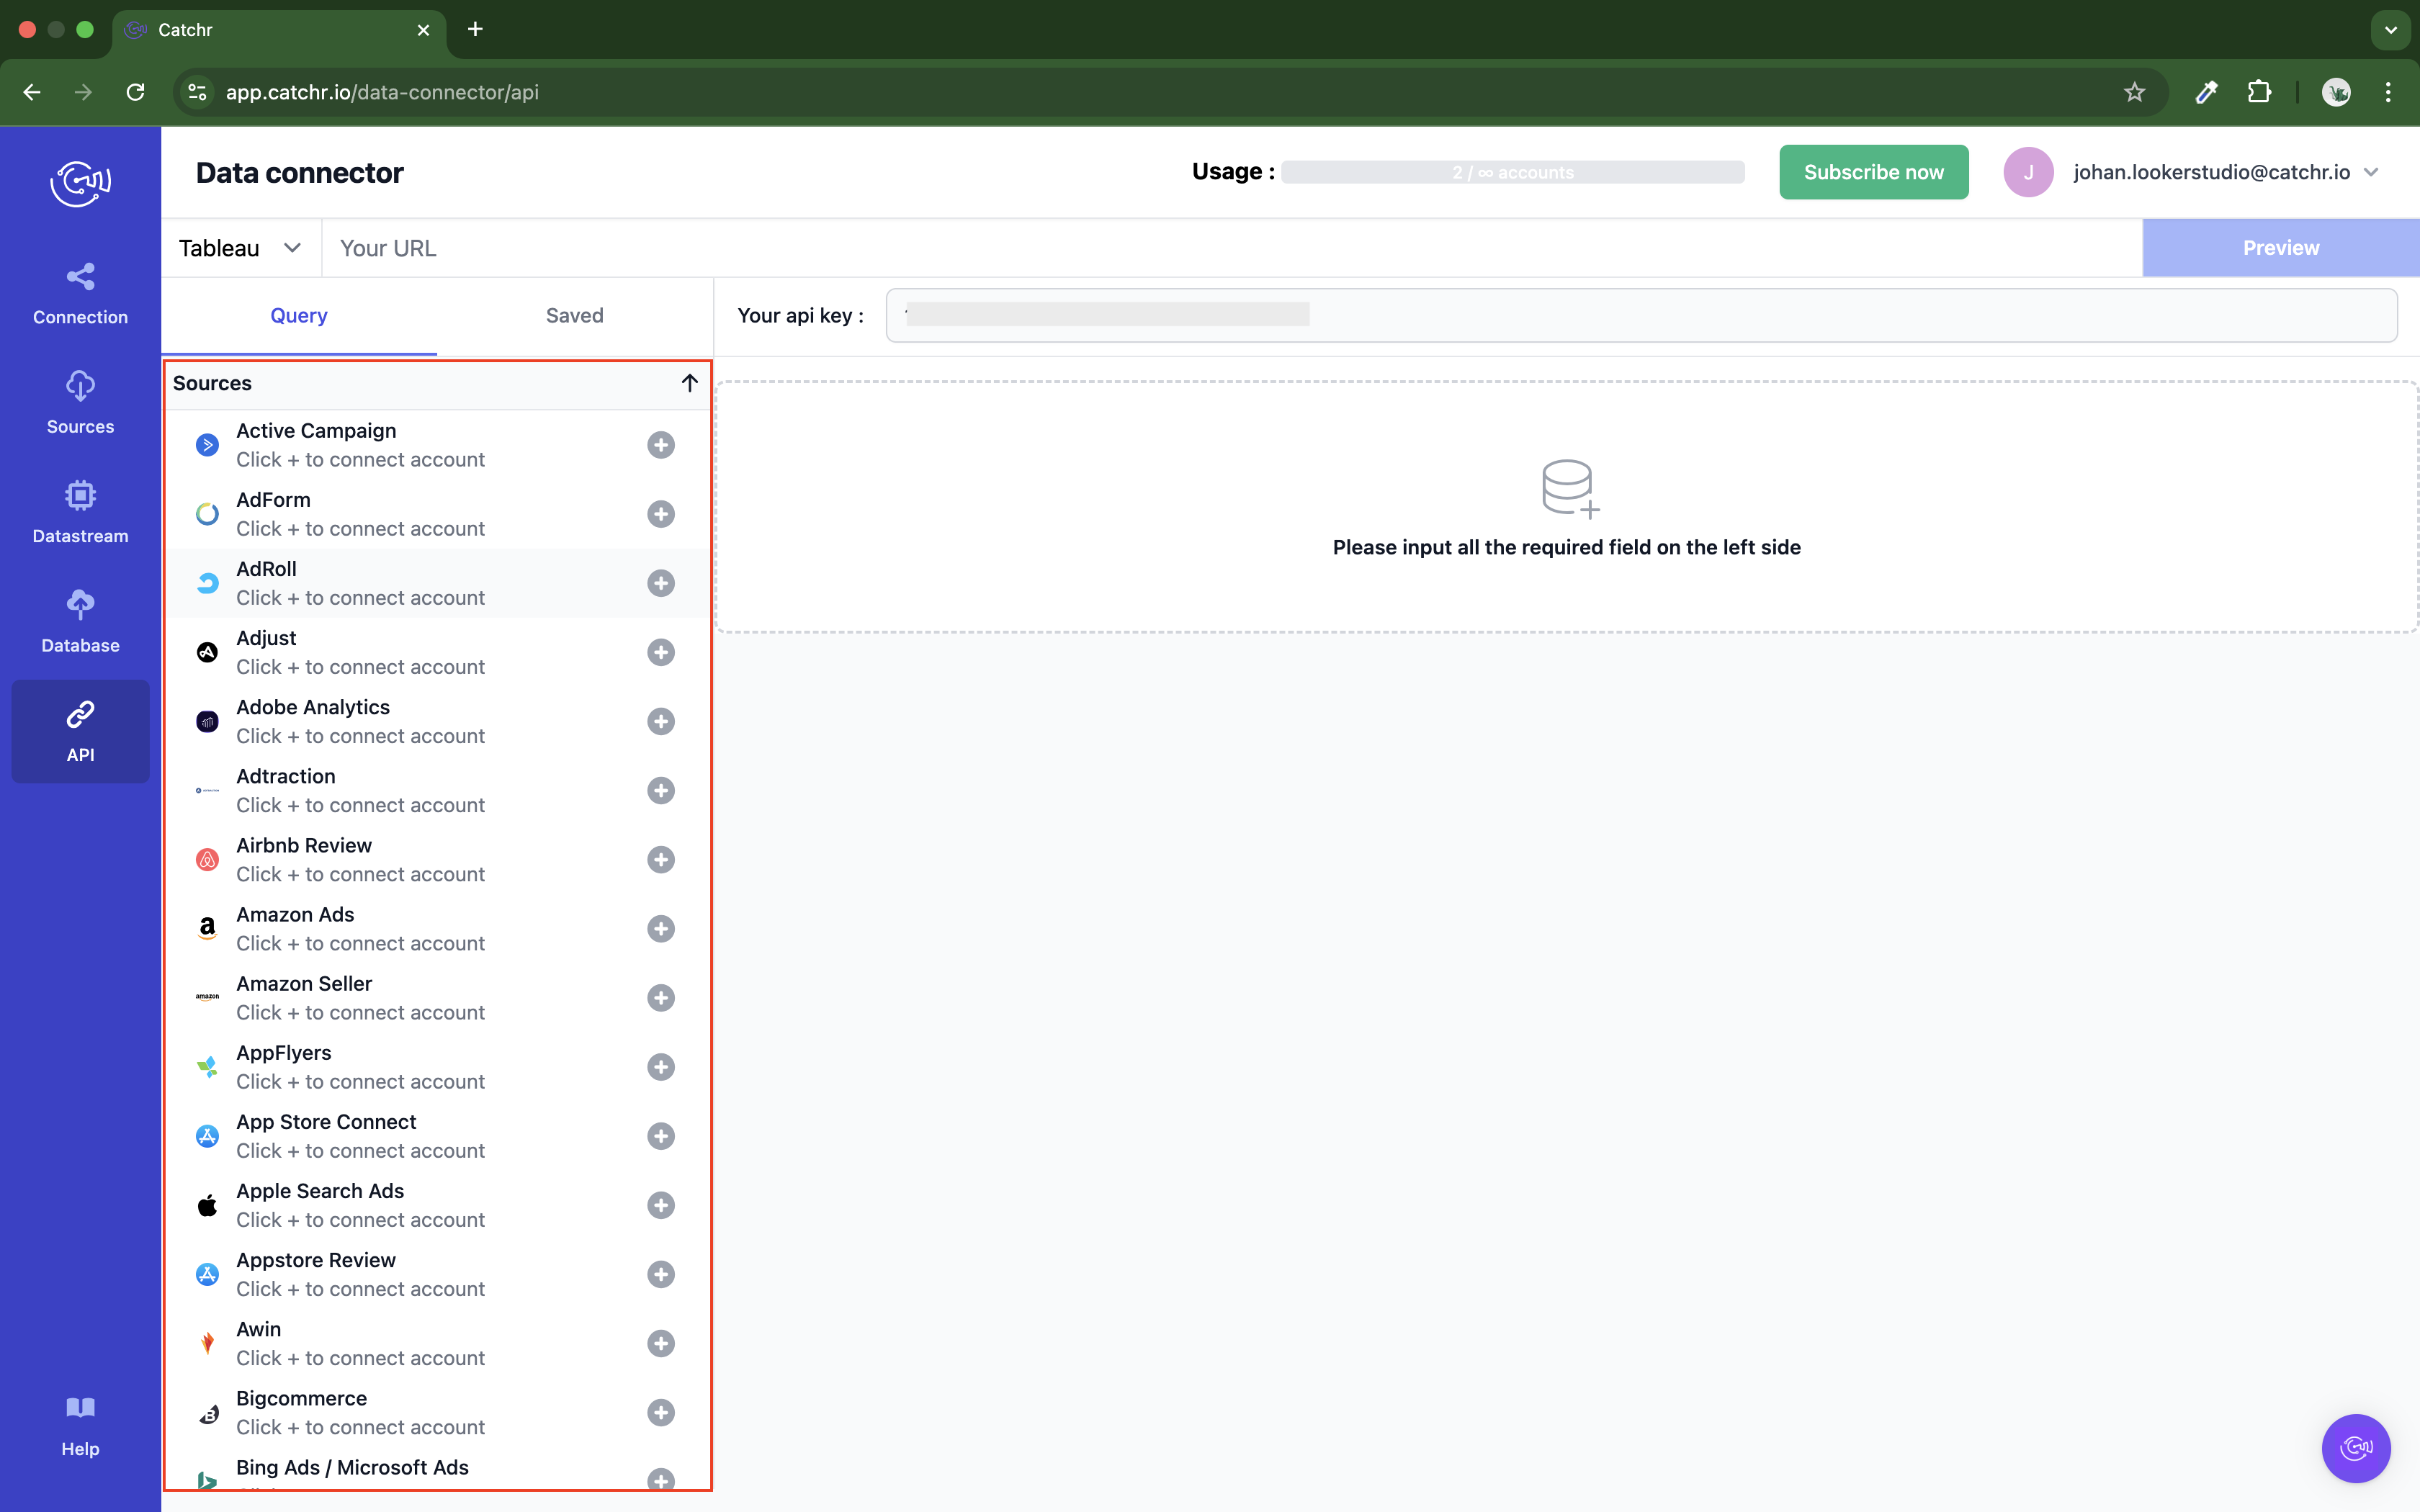
Once you're in the API section of Catchr, follow these steps to create a query compatible with Tableau:
Select the query format.
In the page's top-left corner, choose Tableau as the query format.
Select the platform.
Choose the platform from which the data will be pulled.
You must have already connected a source to Catchr (see this tutorial to add a Catchr Source).
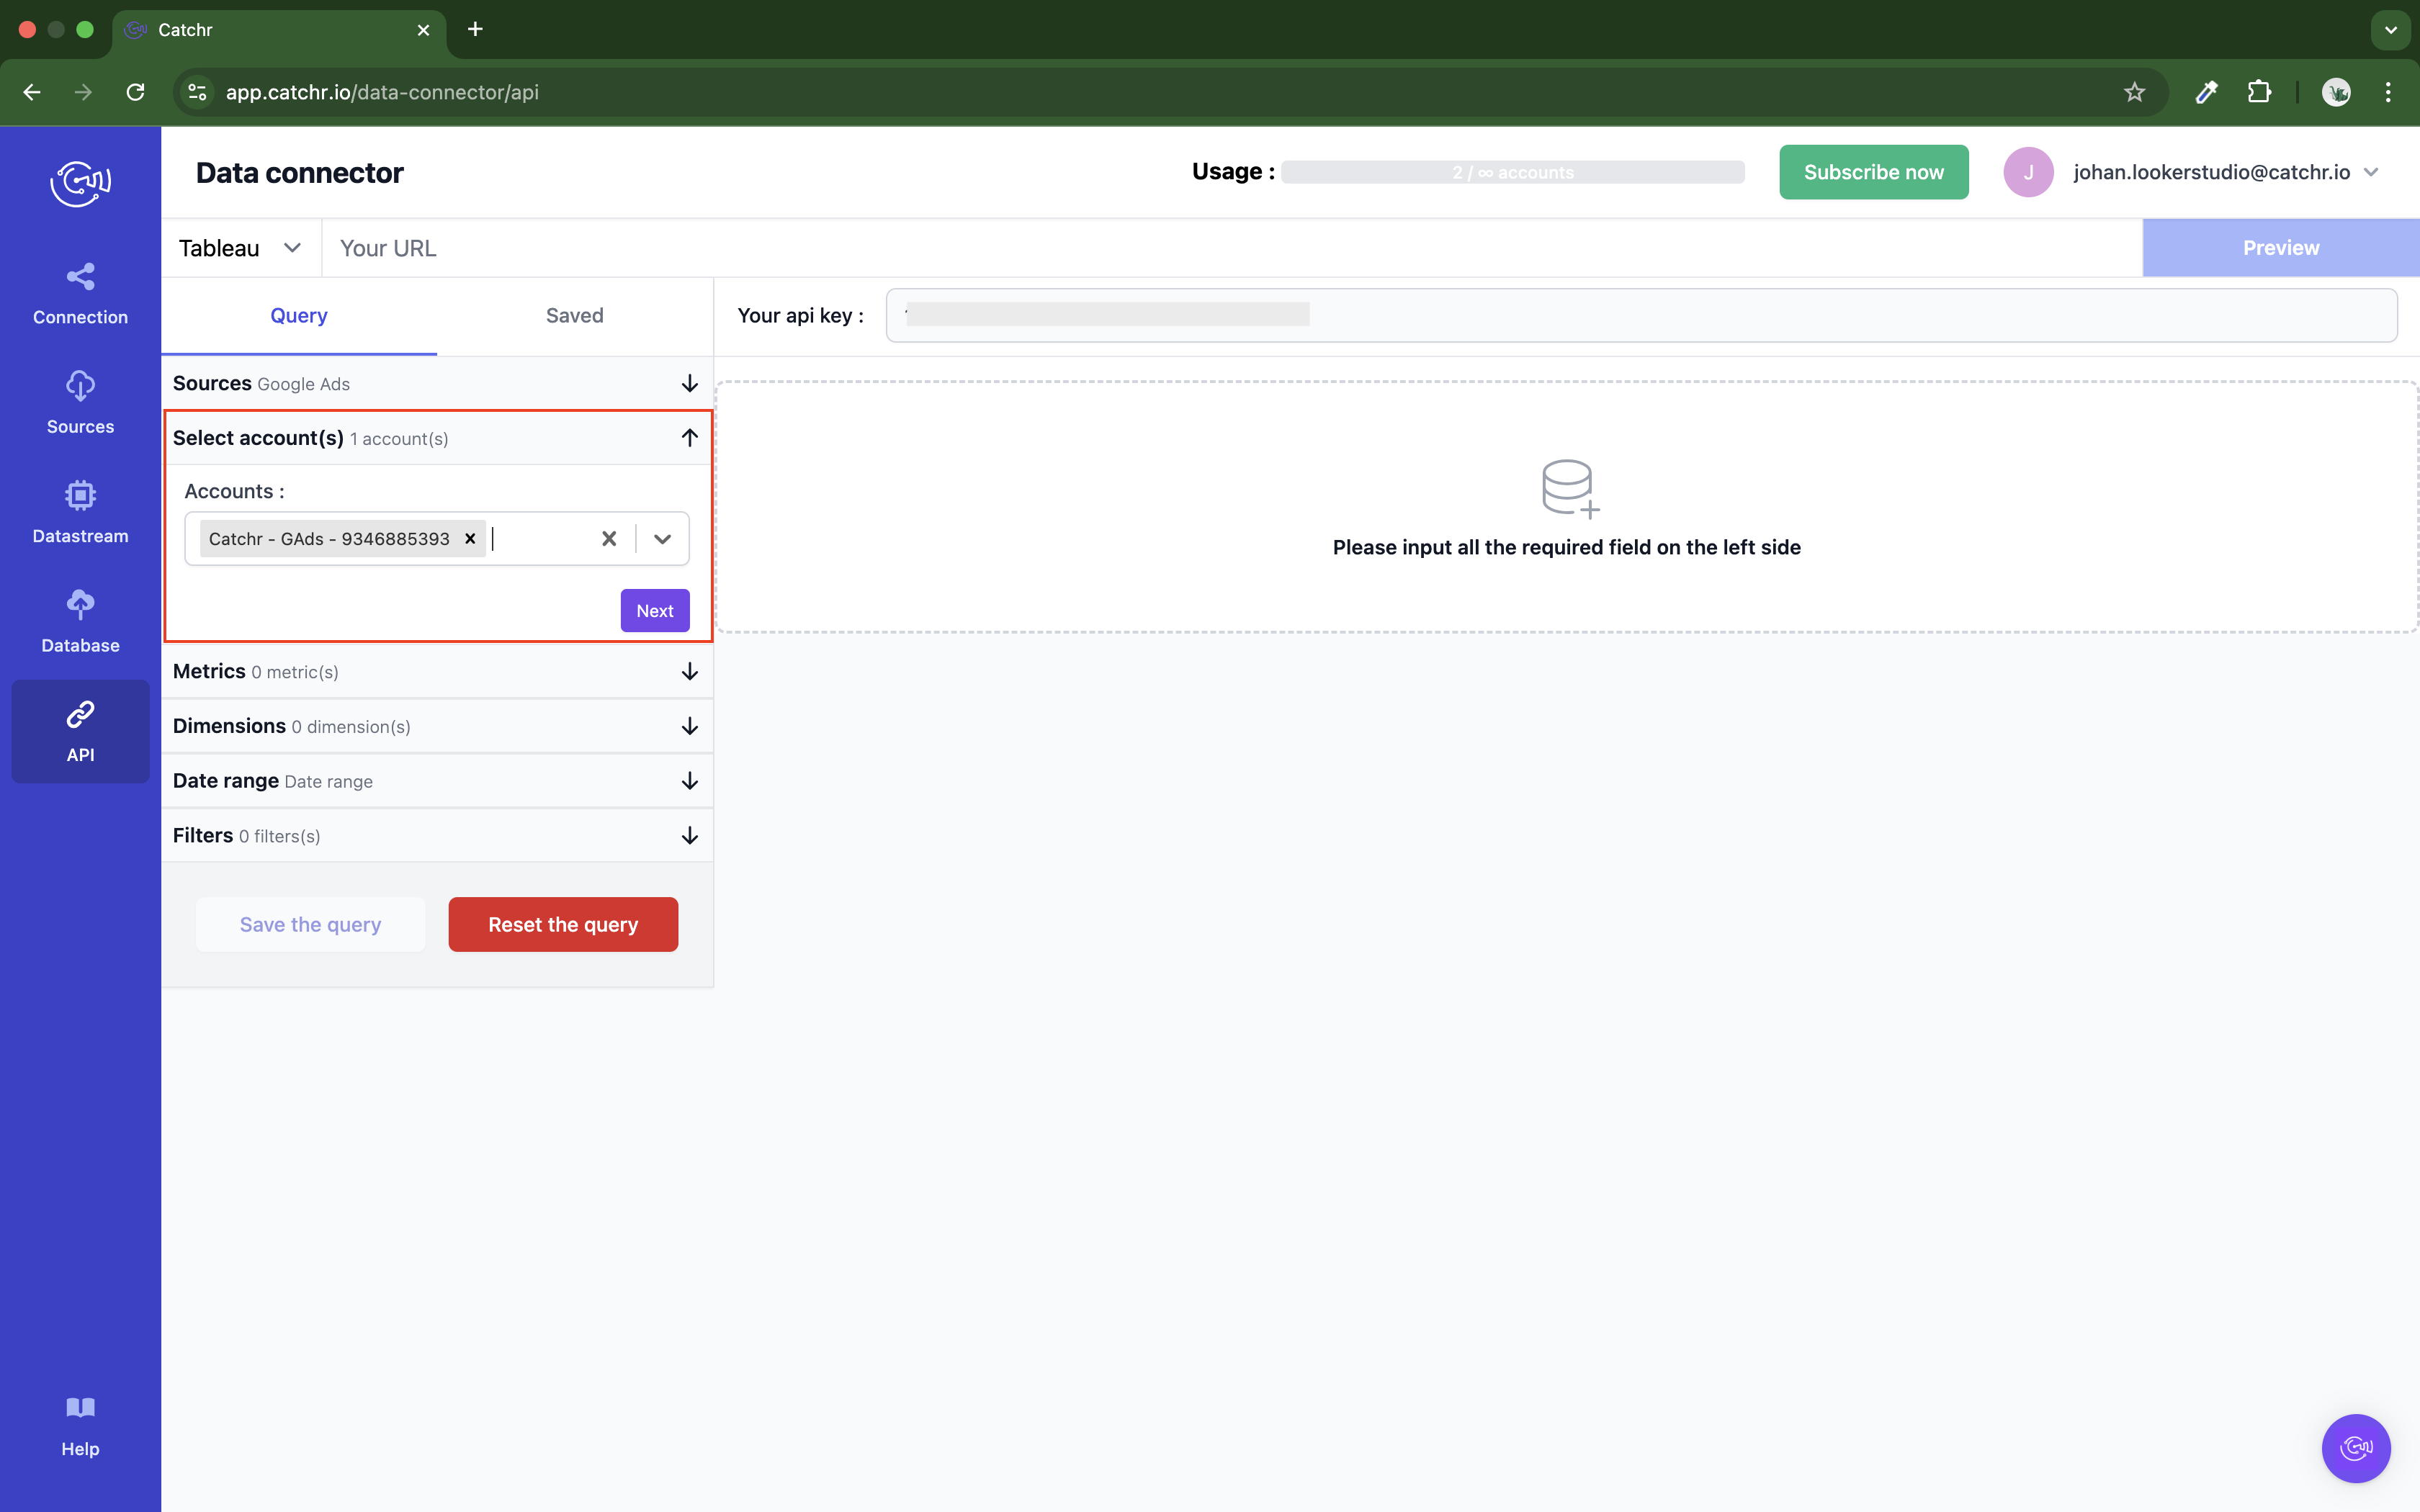
Select the account(s).
Choose one or more accounts associated with the selected platform.
Select the metrics.
Pick the metrics you want to retrieve.
 This section might take a few seconds to load, and it may not appear immediately — some platforms don't provide metrics, so the menu is hidden by default.

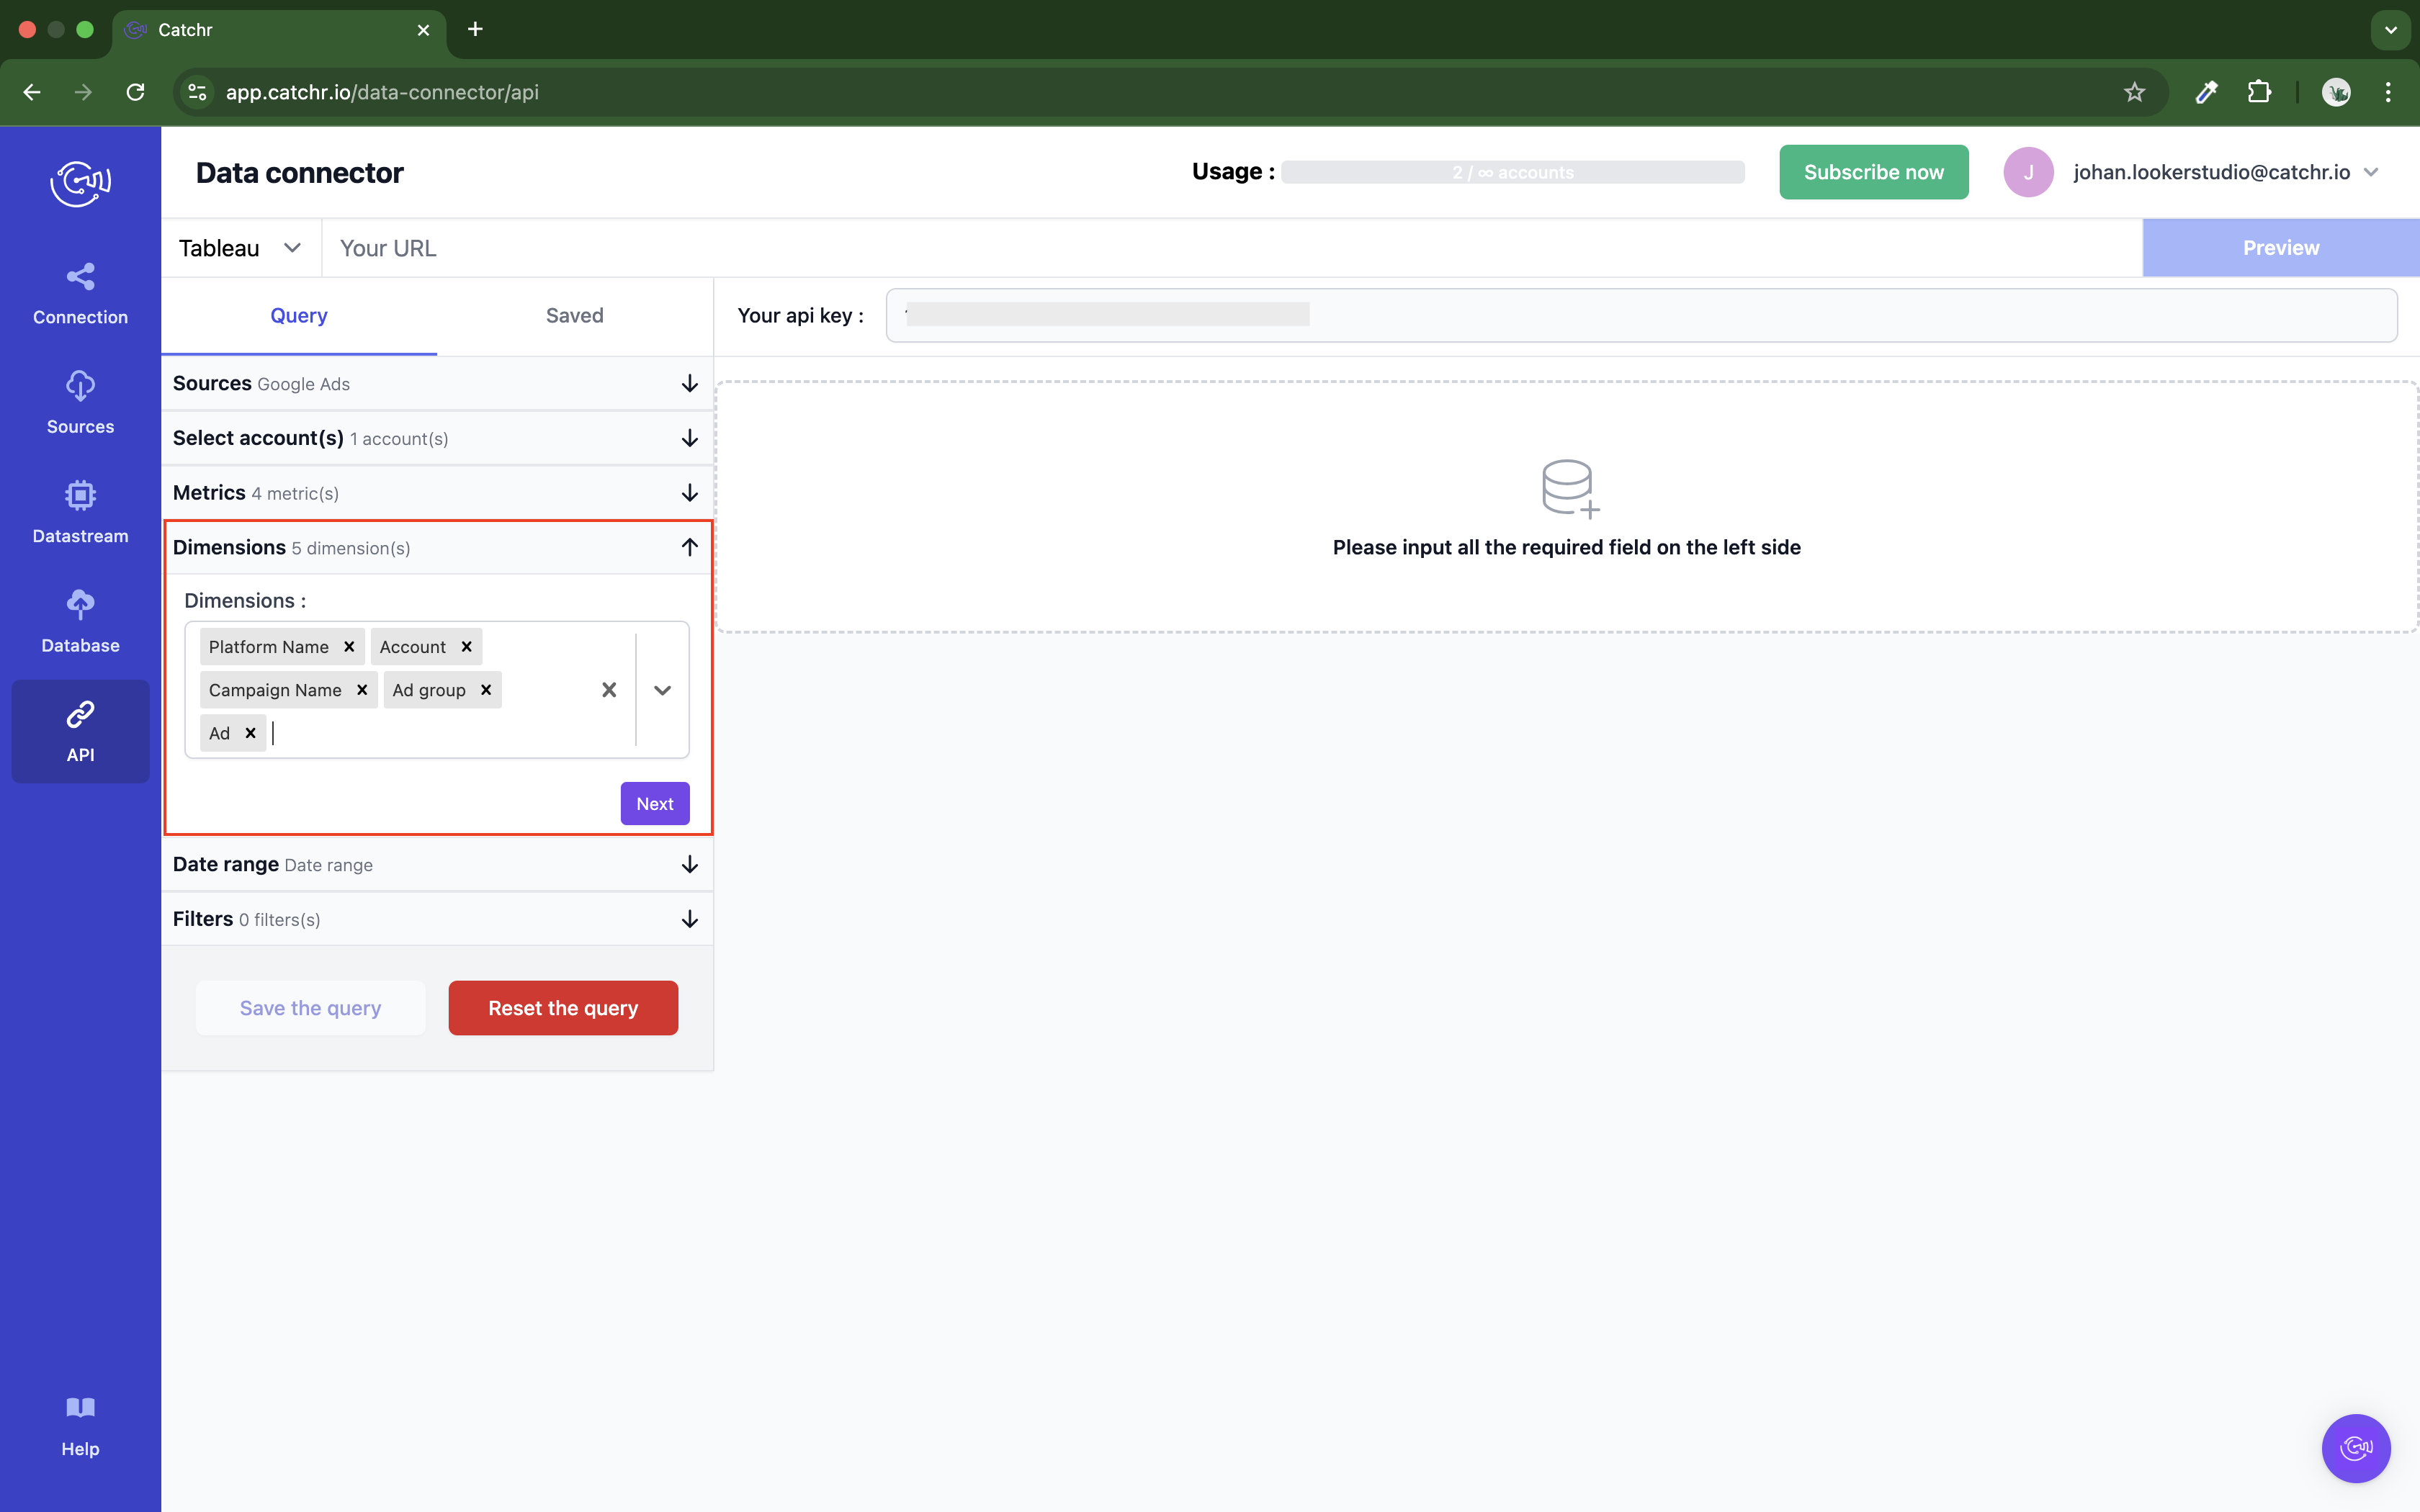
Select the dimensions.
Choose the dimensions that will structure your data.
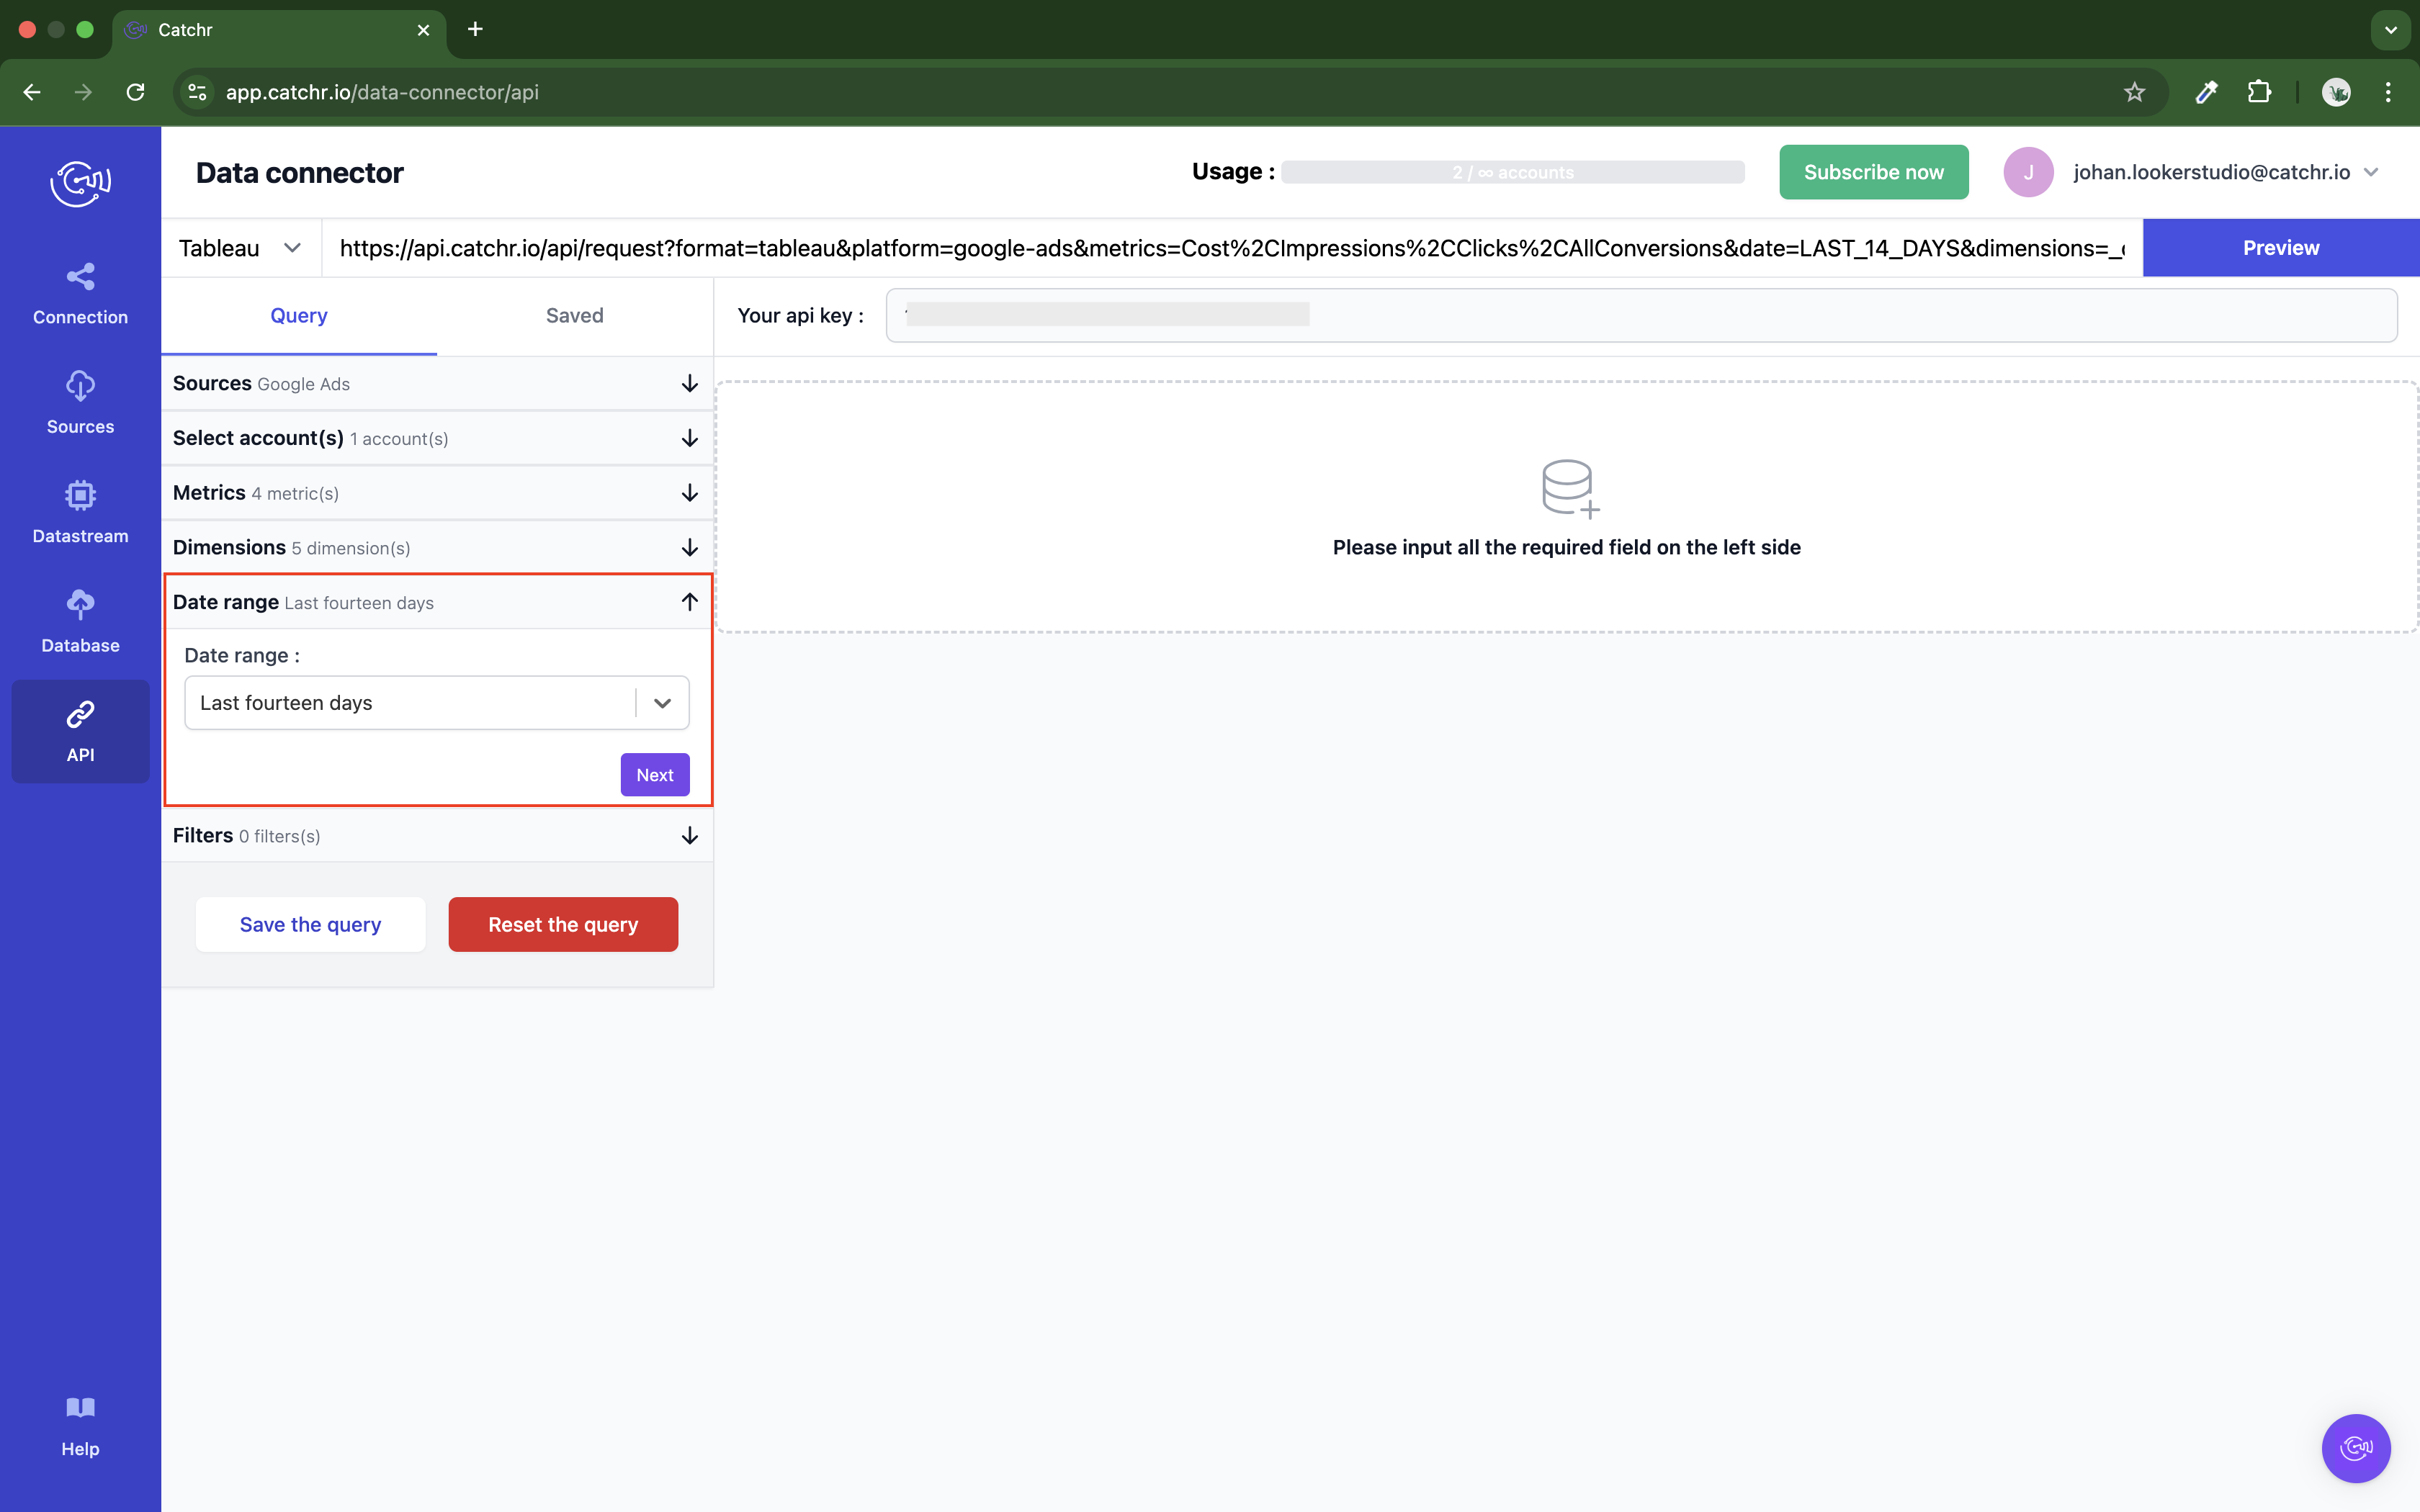
Choose a date range.
Set the date range for the data you want to retrieve.
This is the last required step to build your query. You can try to preview it now.
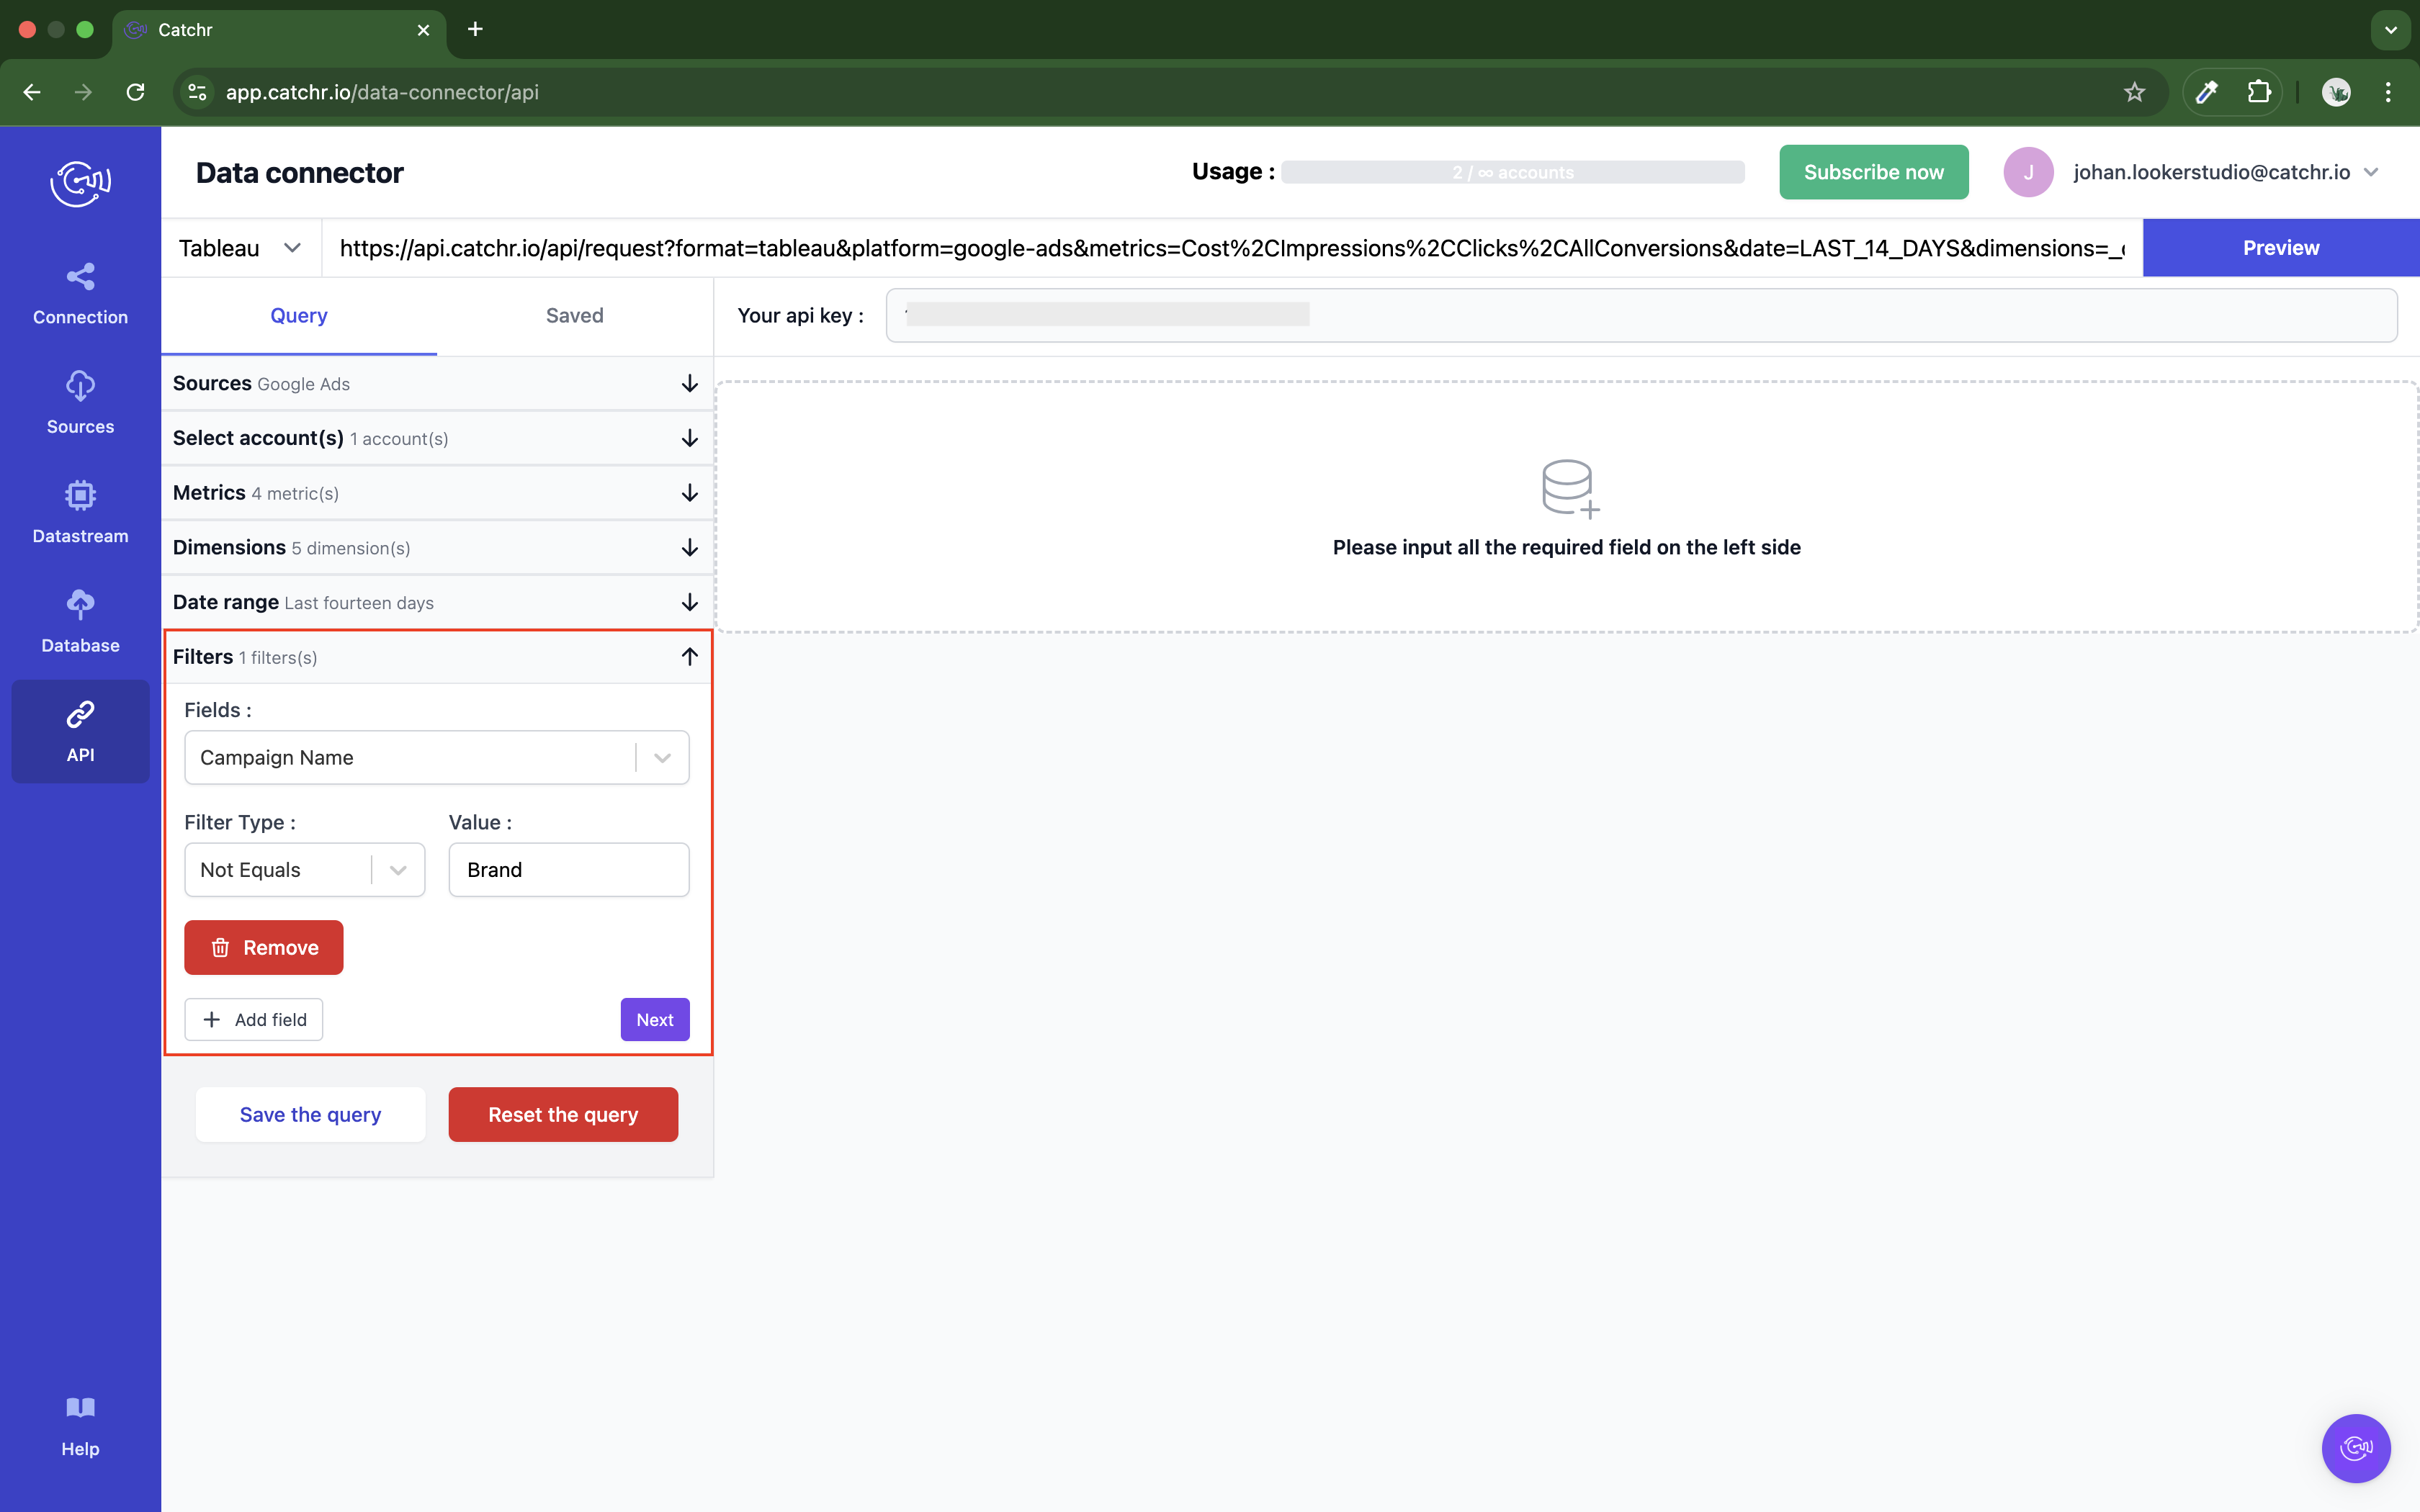
(Optional) Apply filters.
You can add filters to narrow your results.
Filters are combined using AND logic. If you need an OR condition, you must create multiple queries and integrate the data on Tableau.
(Optional) Choose additional options.
Some platforms provide extra configuration options. If available, they will appear in this section.
If the configuration is untouched, we will take the default configuration.
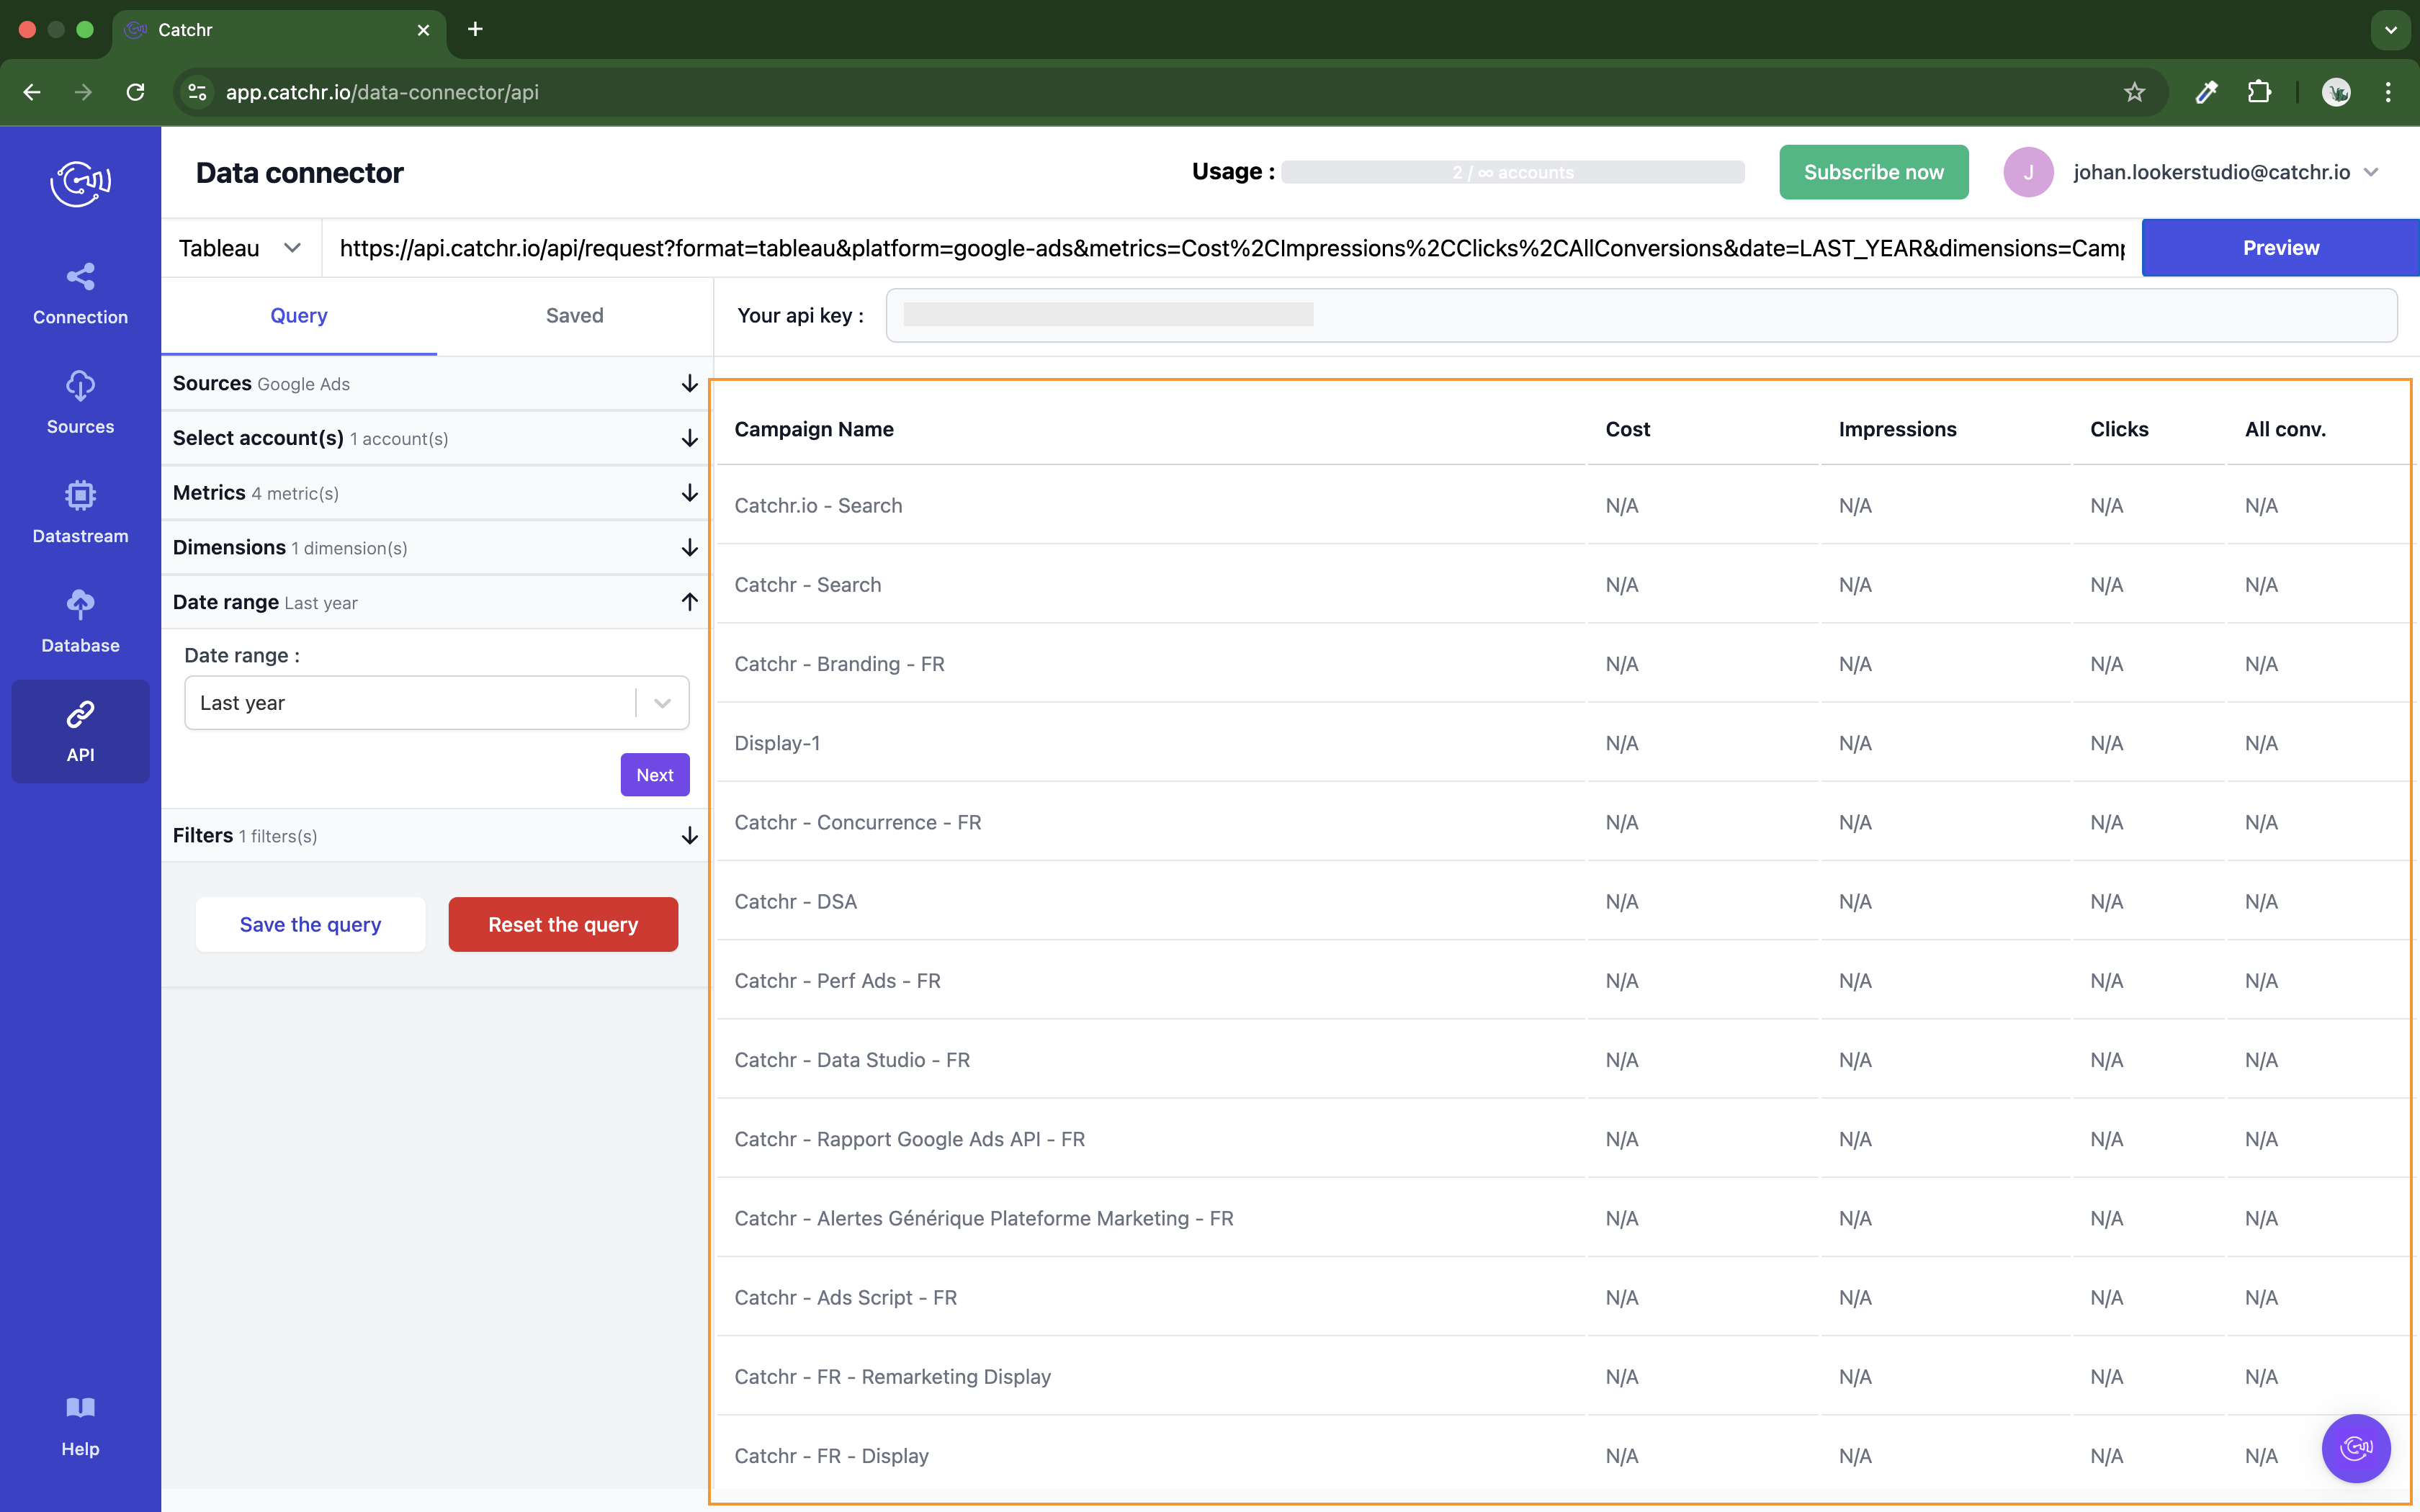
Once your query is configured, click on "Preview data" at the top right to test it.
Catchr will display the data directly on the page if the query is valid.
If there's an issue, an error message will appear instead. To learn more about the issue, go to Troubleshooting common errors.
This step helps ensure everything is working correctly before using the query in Tableau.
Copy the URL by clicking on it.
Now that your request is created on Catchr and you have the associated URL, open Tableau.
In the lefty menu, click More… under To a server. And select Catchr - Data Connector par catchr.
Paste the URL and click OK.
You can now start creating your dashboard.
When testing your query with the "Preview data" button, most valid queries will return a response — even if there’s no data for the selected date.
In this case, Catchr will display an empty table with visible column headers, but no data rows.
However, you may still encounter other types of errors:
Error message:
"An invalid mapping has been set in your request [metrics and dimensions name]. Please change your field or contact us on our live chat for more information."
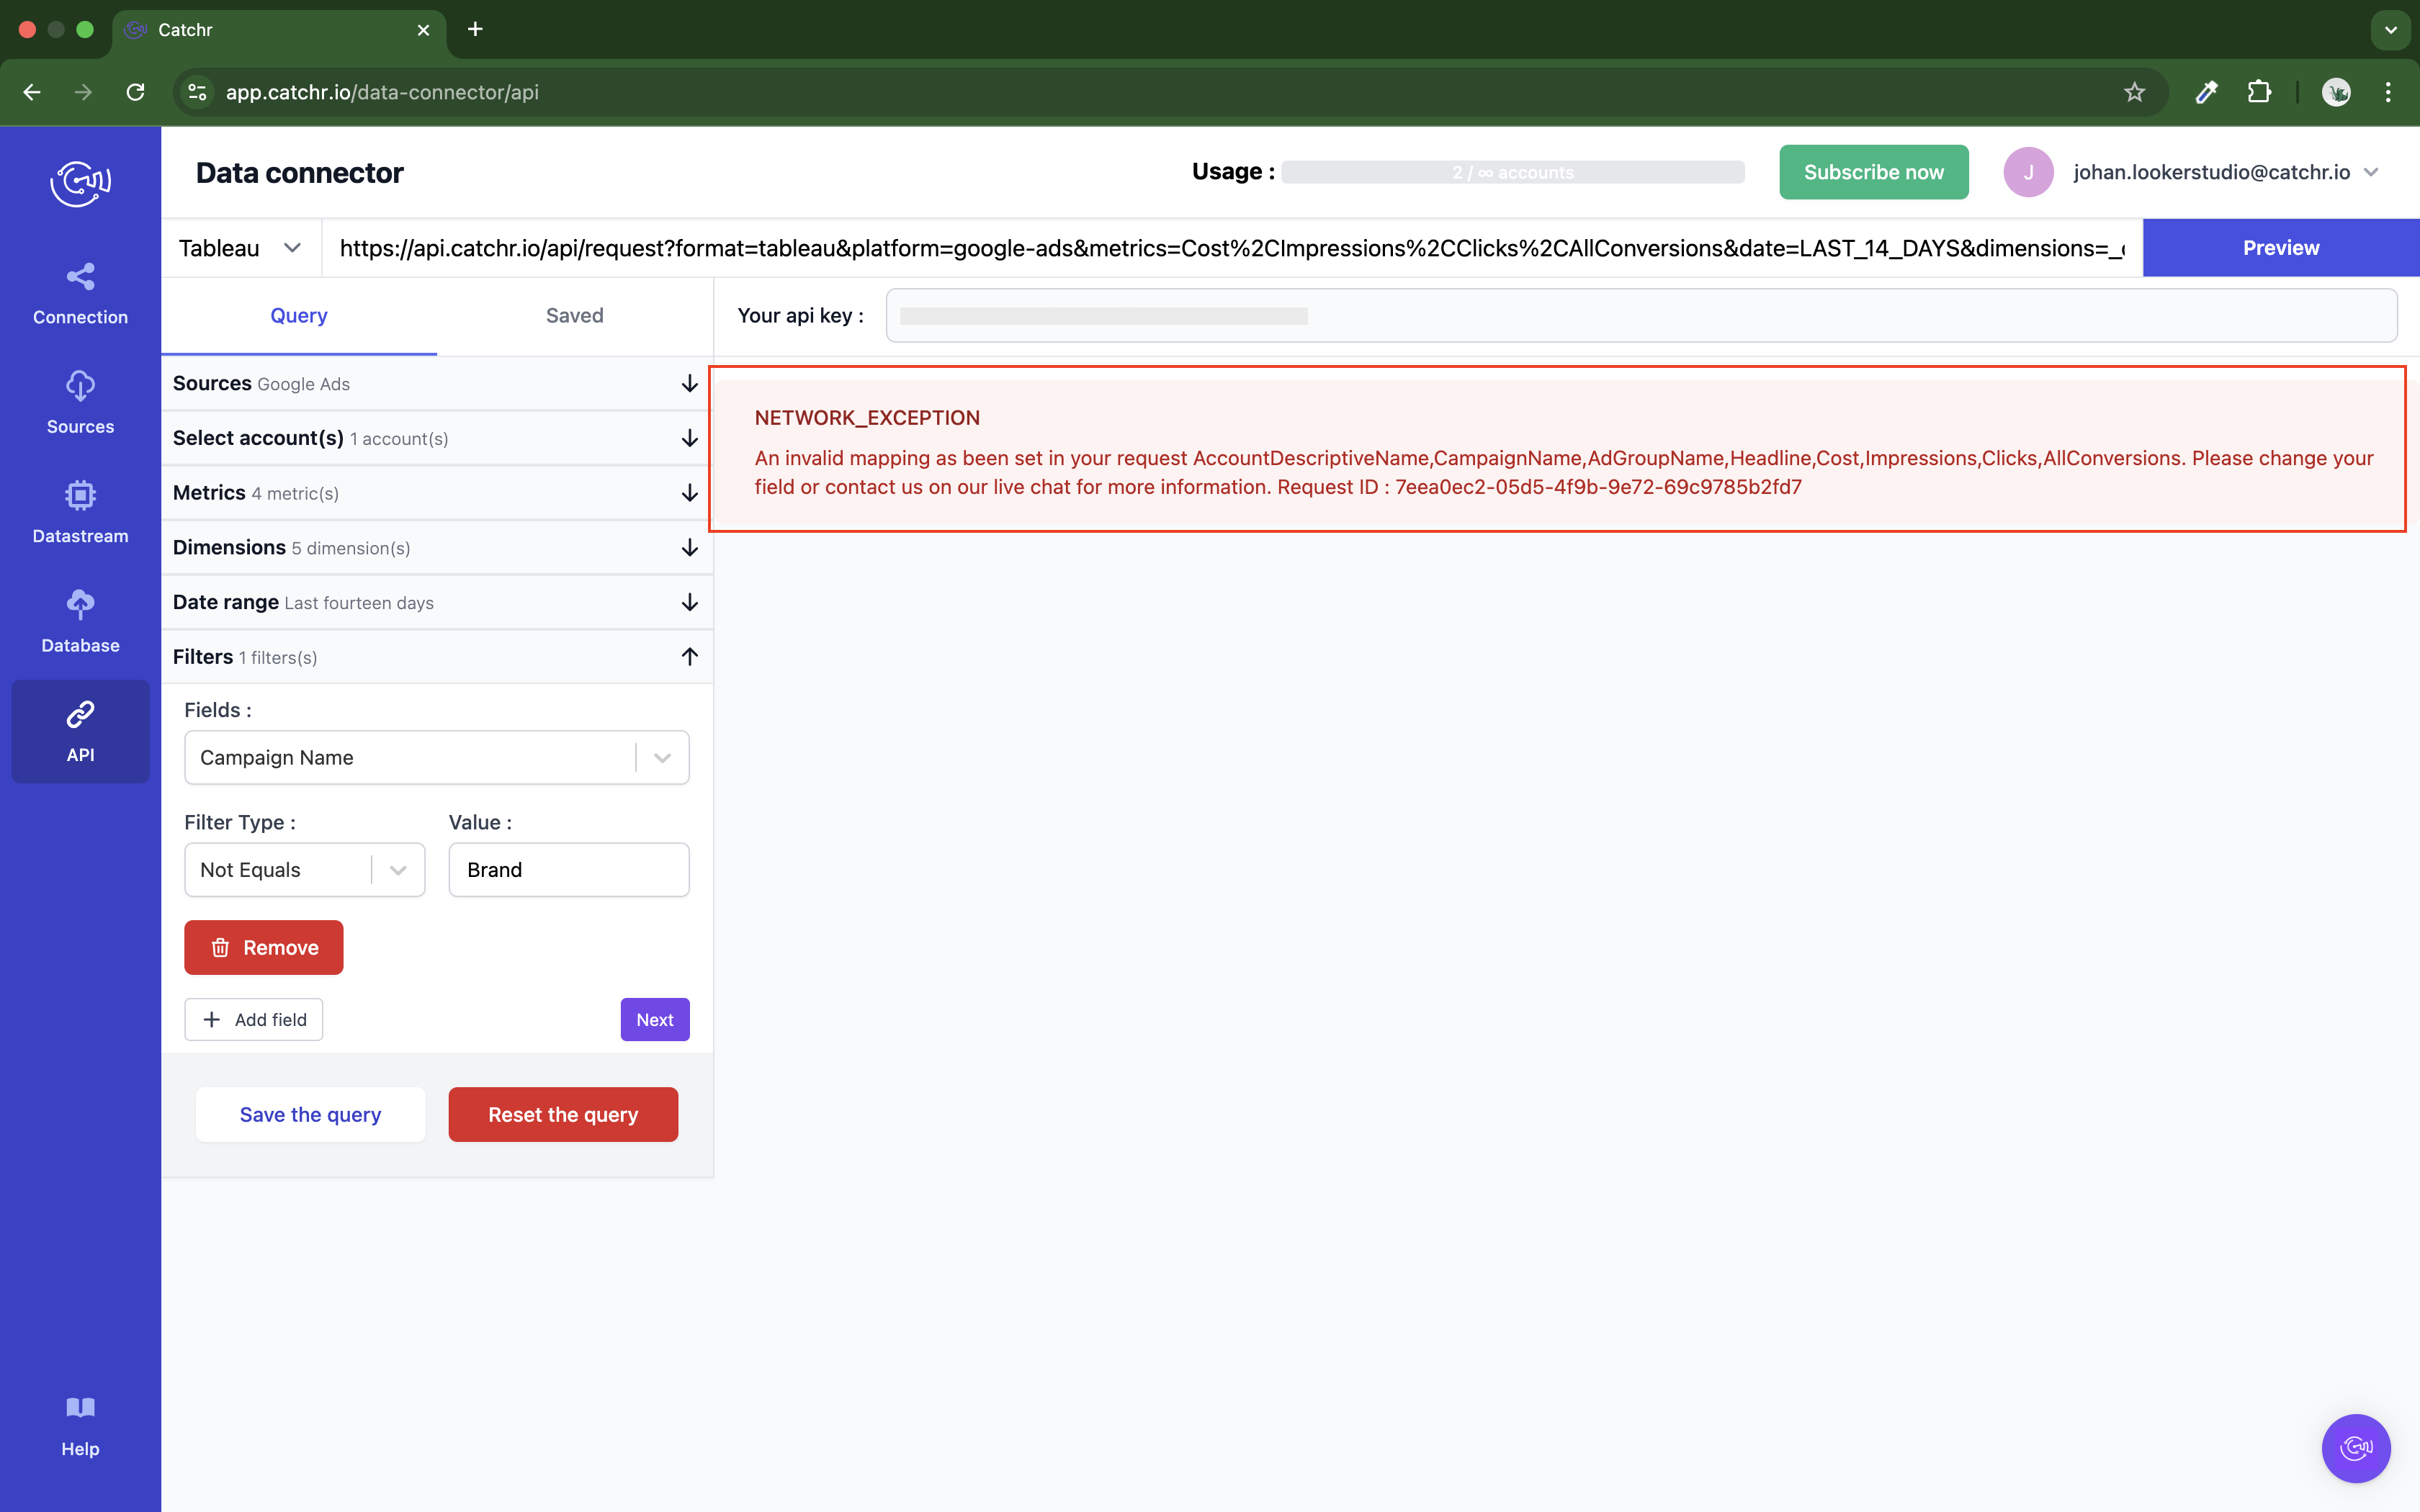
Some fields cannot be used together due to data platform or API limitations.
Try adjusting your selection by removing or replacing specific metrics or dimensions.
If another error occurs or the preview doesn't work as expected, don’t hesitate to contact us via the in-app chat or at [email protected] — we’re here to help!