This tutorial shows how to create a GEO monitor, review generated prompts, and read monitor results in both list and detail views.
A monitor tracks how your brand appears in AI responses for a defined market setup:
- One brand name
- One country
- One language
- One or more models
- A set of prompts
A prompt is a user-like question GEO sends to selected AI models to measure your brand visibility, sentiment, and citations.
- You already created a workspace for your brand (see this page).
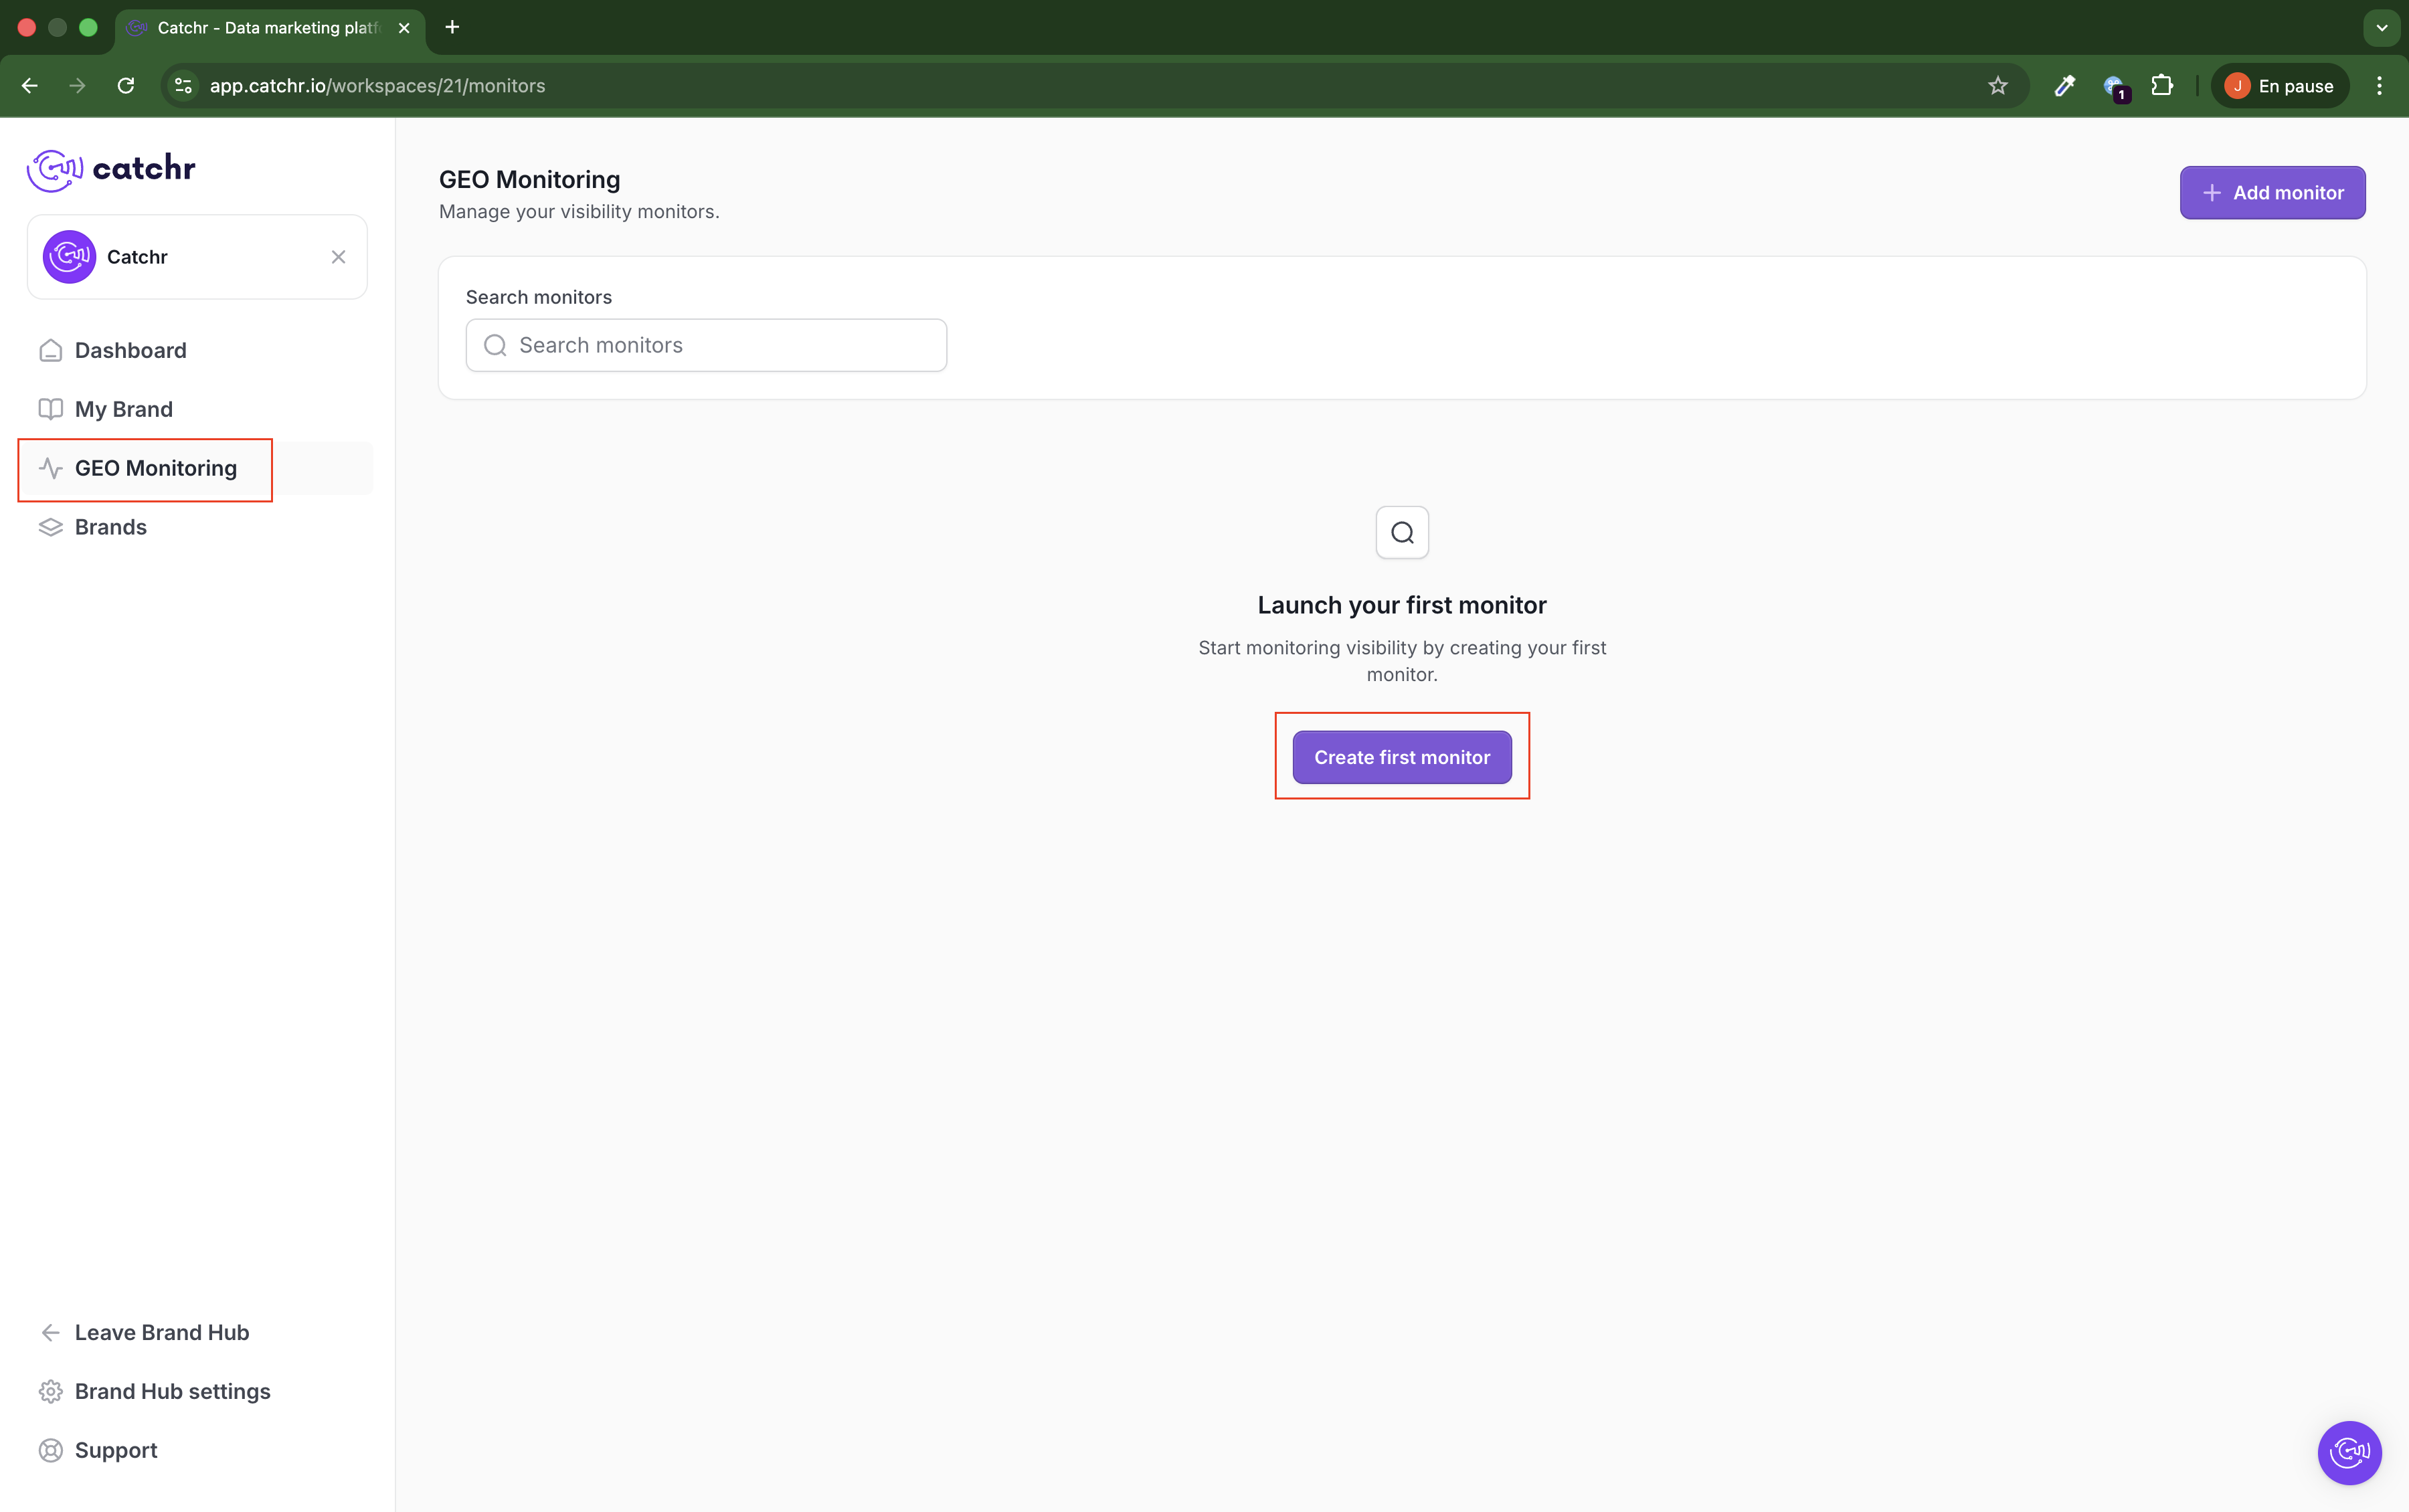
Open GEO Monitoring from the left sidebar, then click Create first monitor (or Add monitor).
This is the default empty state when no monitor exists yet.
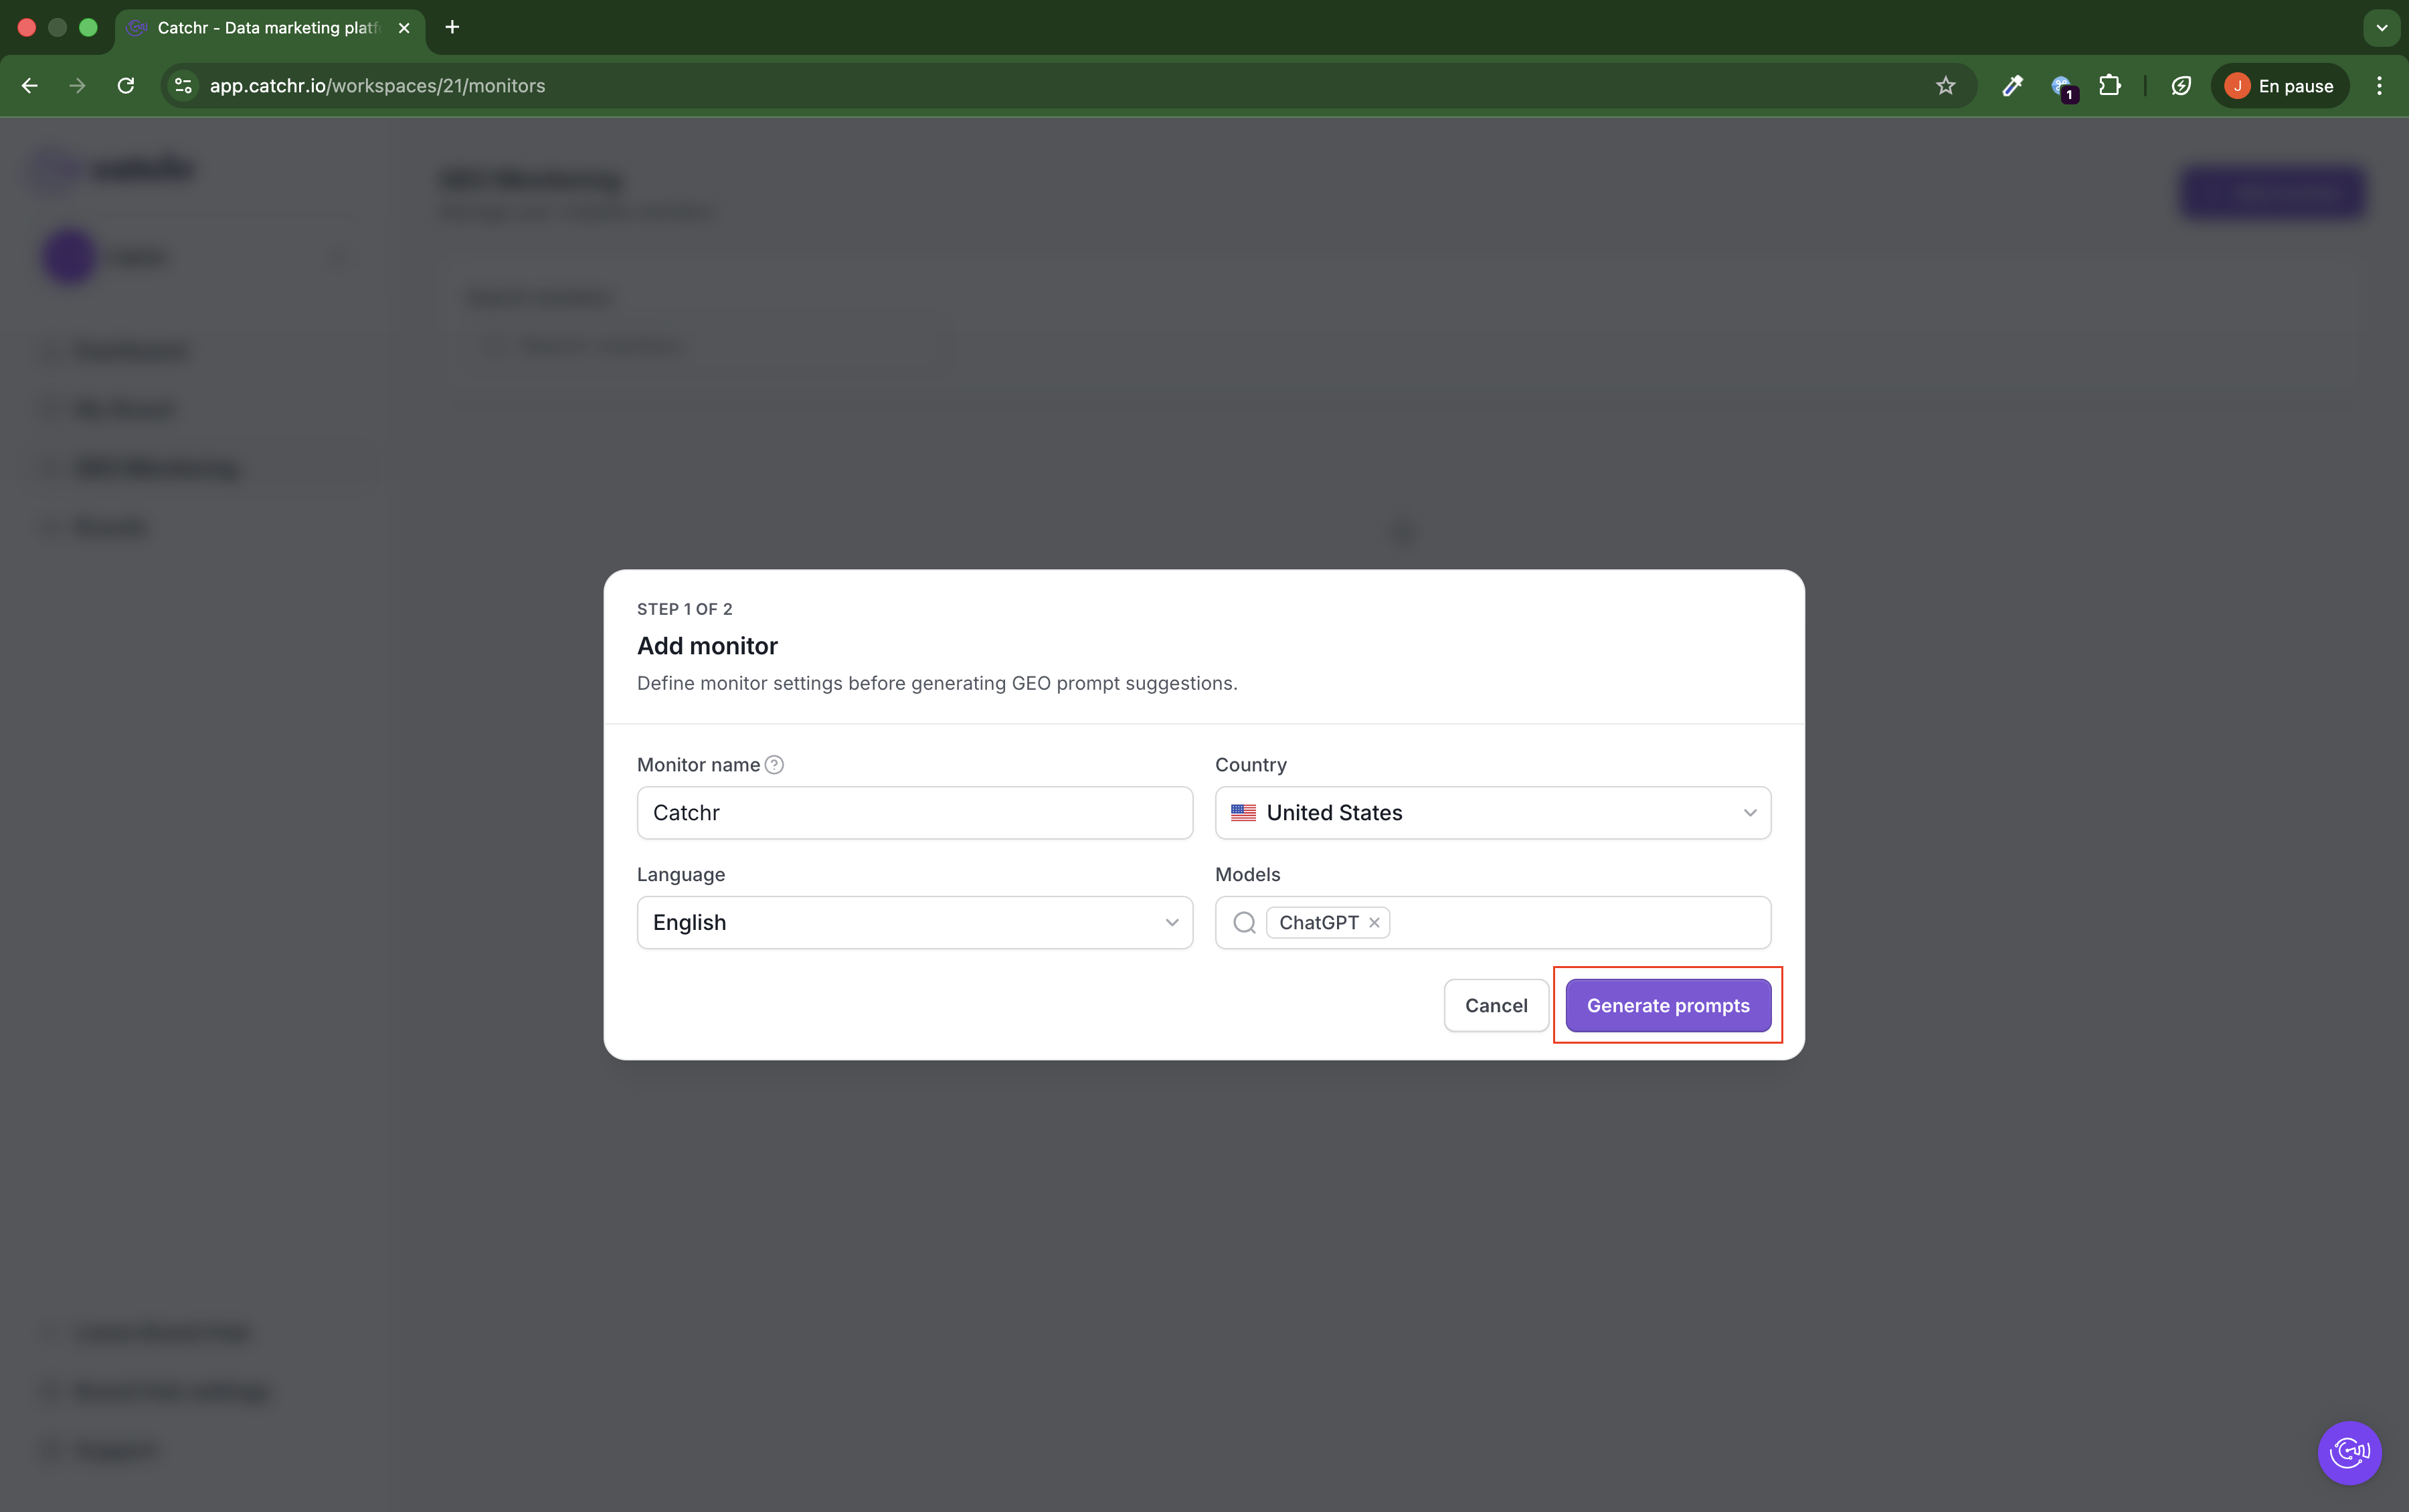
In Step 1 of 2, fill in:
- Monitor name (usually your brand name)
- Country
- Language
- Models
Then click Generate prompts (this can take a few minutes).
If the model you need is not available, request it in the Catchr chat.
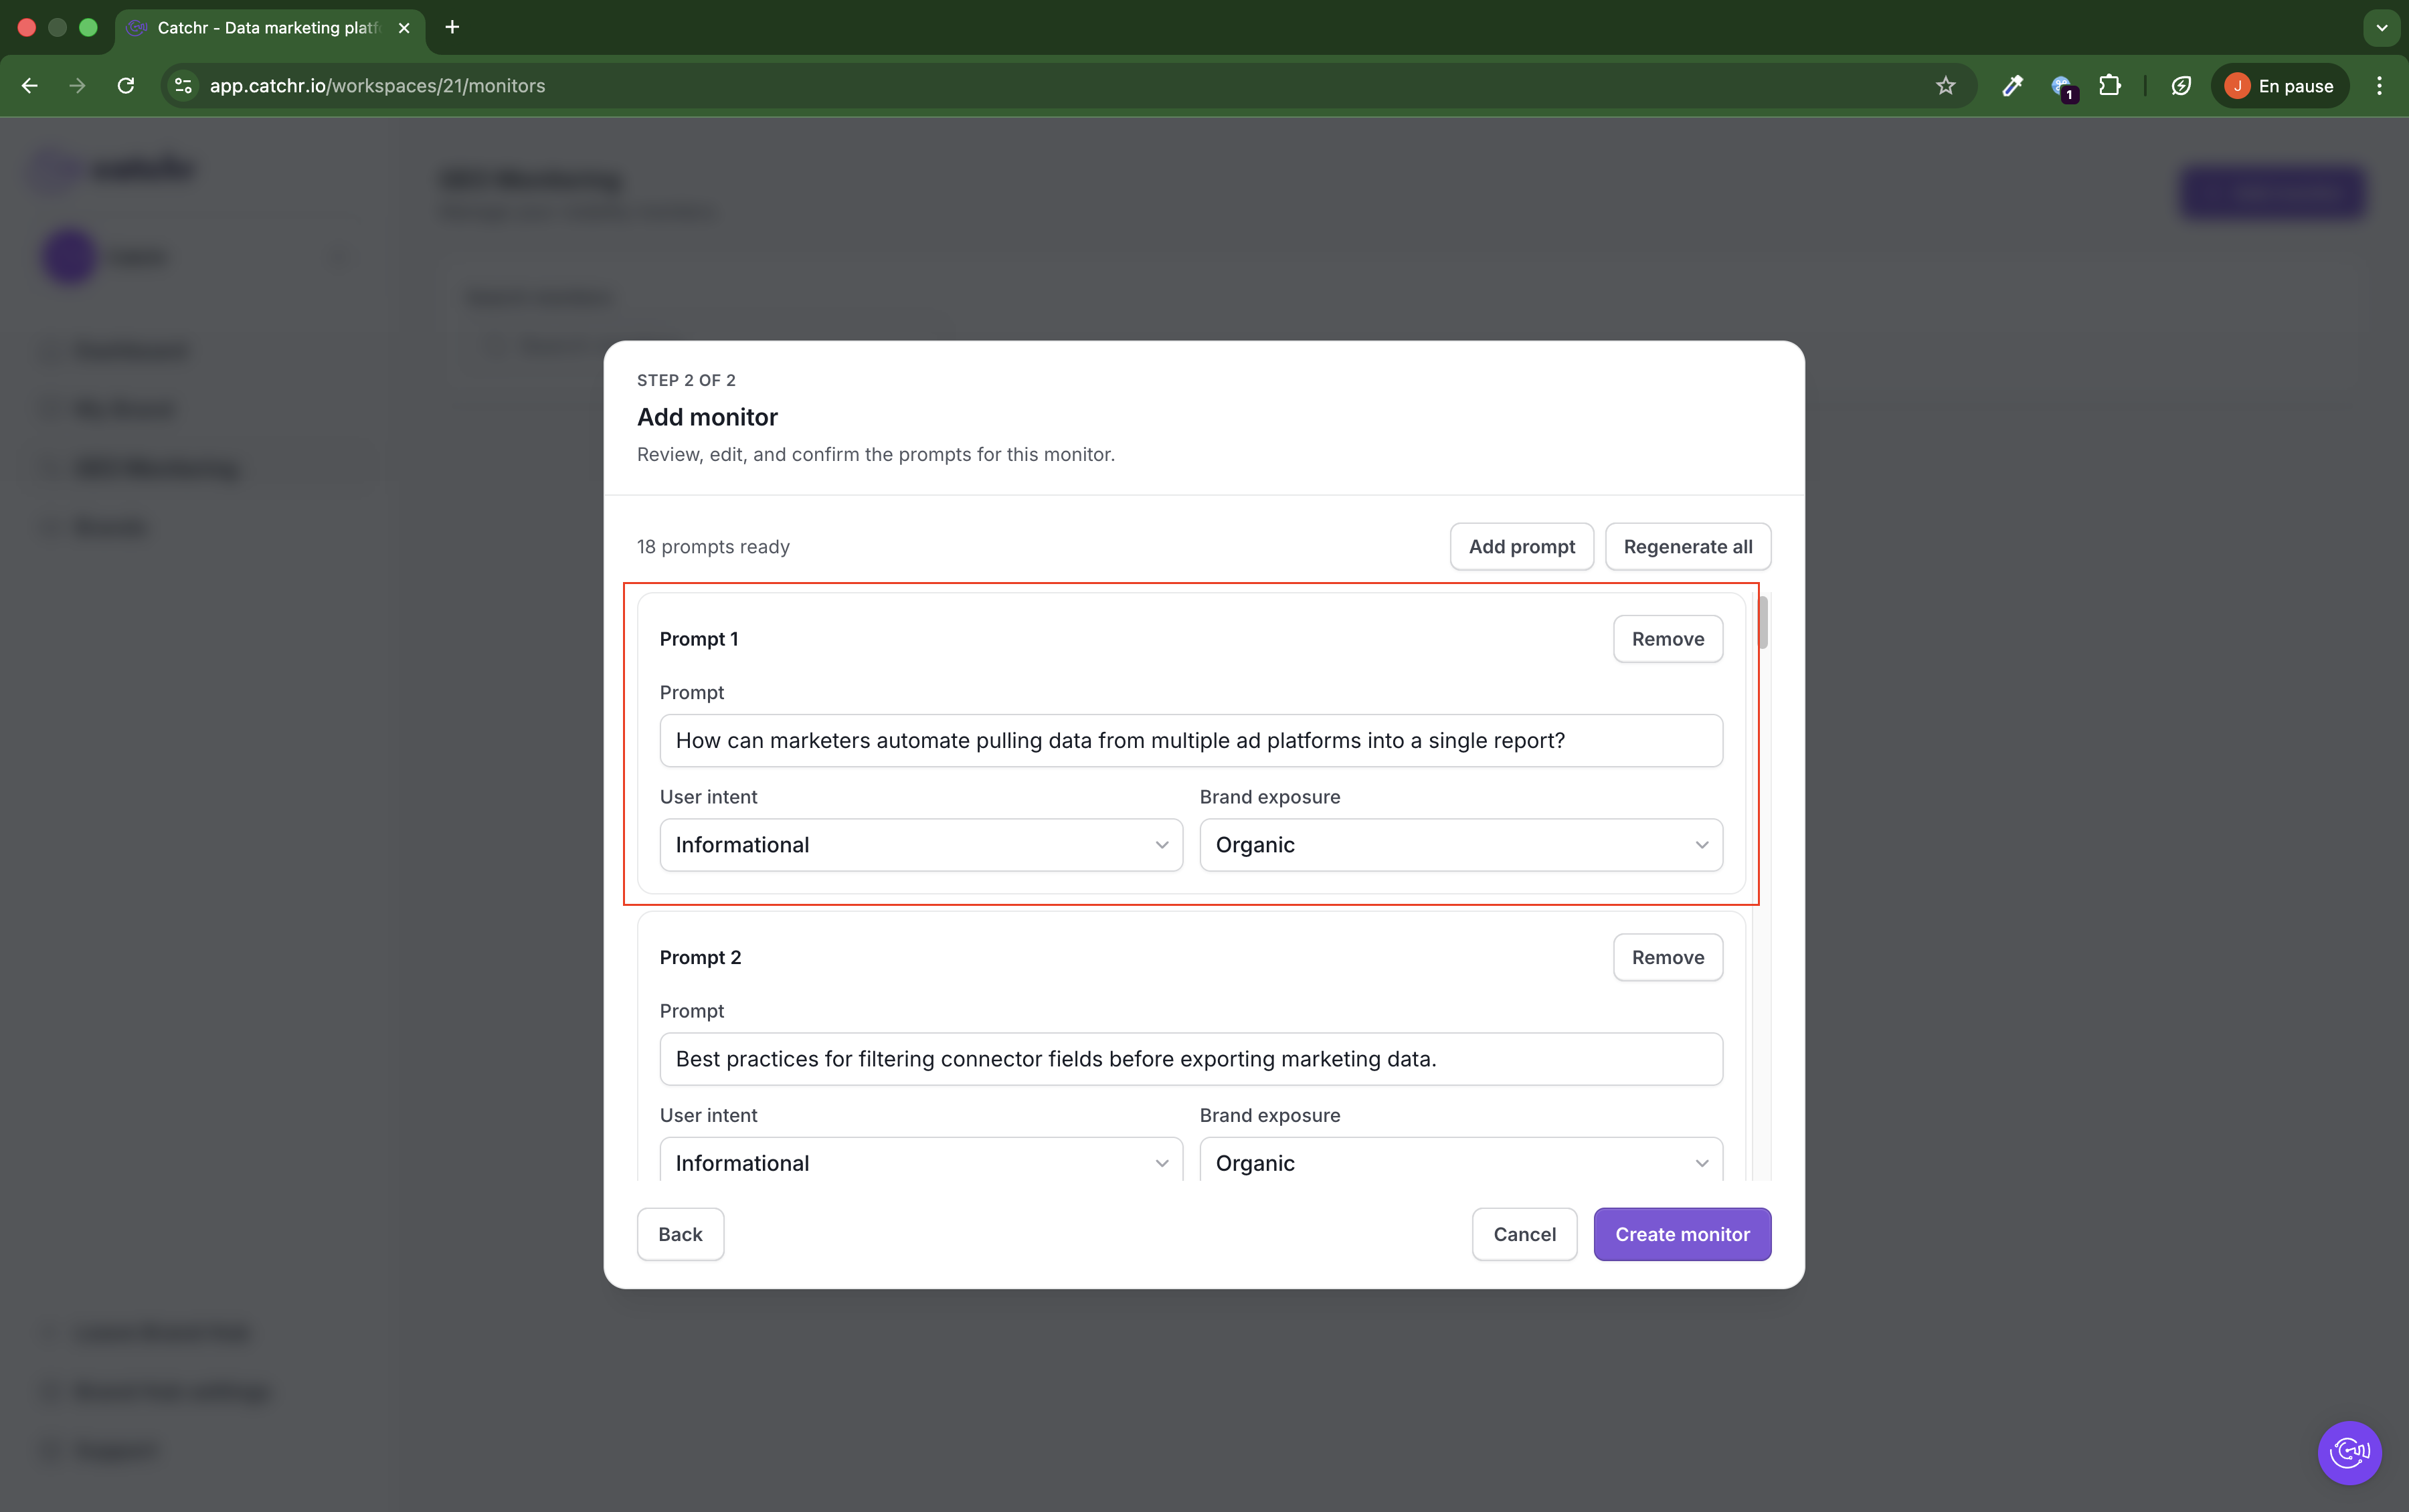
In Step 2 of 2, review generated prompts and adjust them if needed.
You can:
- Edit prompt text directly in each prompt block.
- Adjust User intent and Brand exposure.
- Remove prompts.
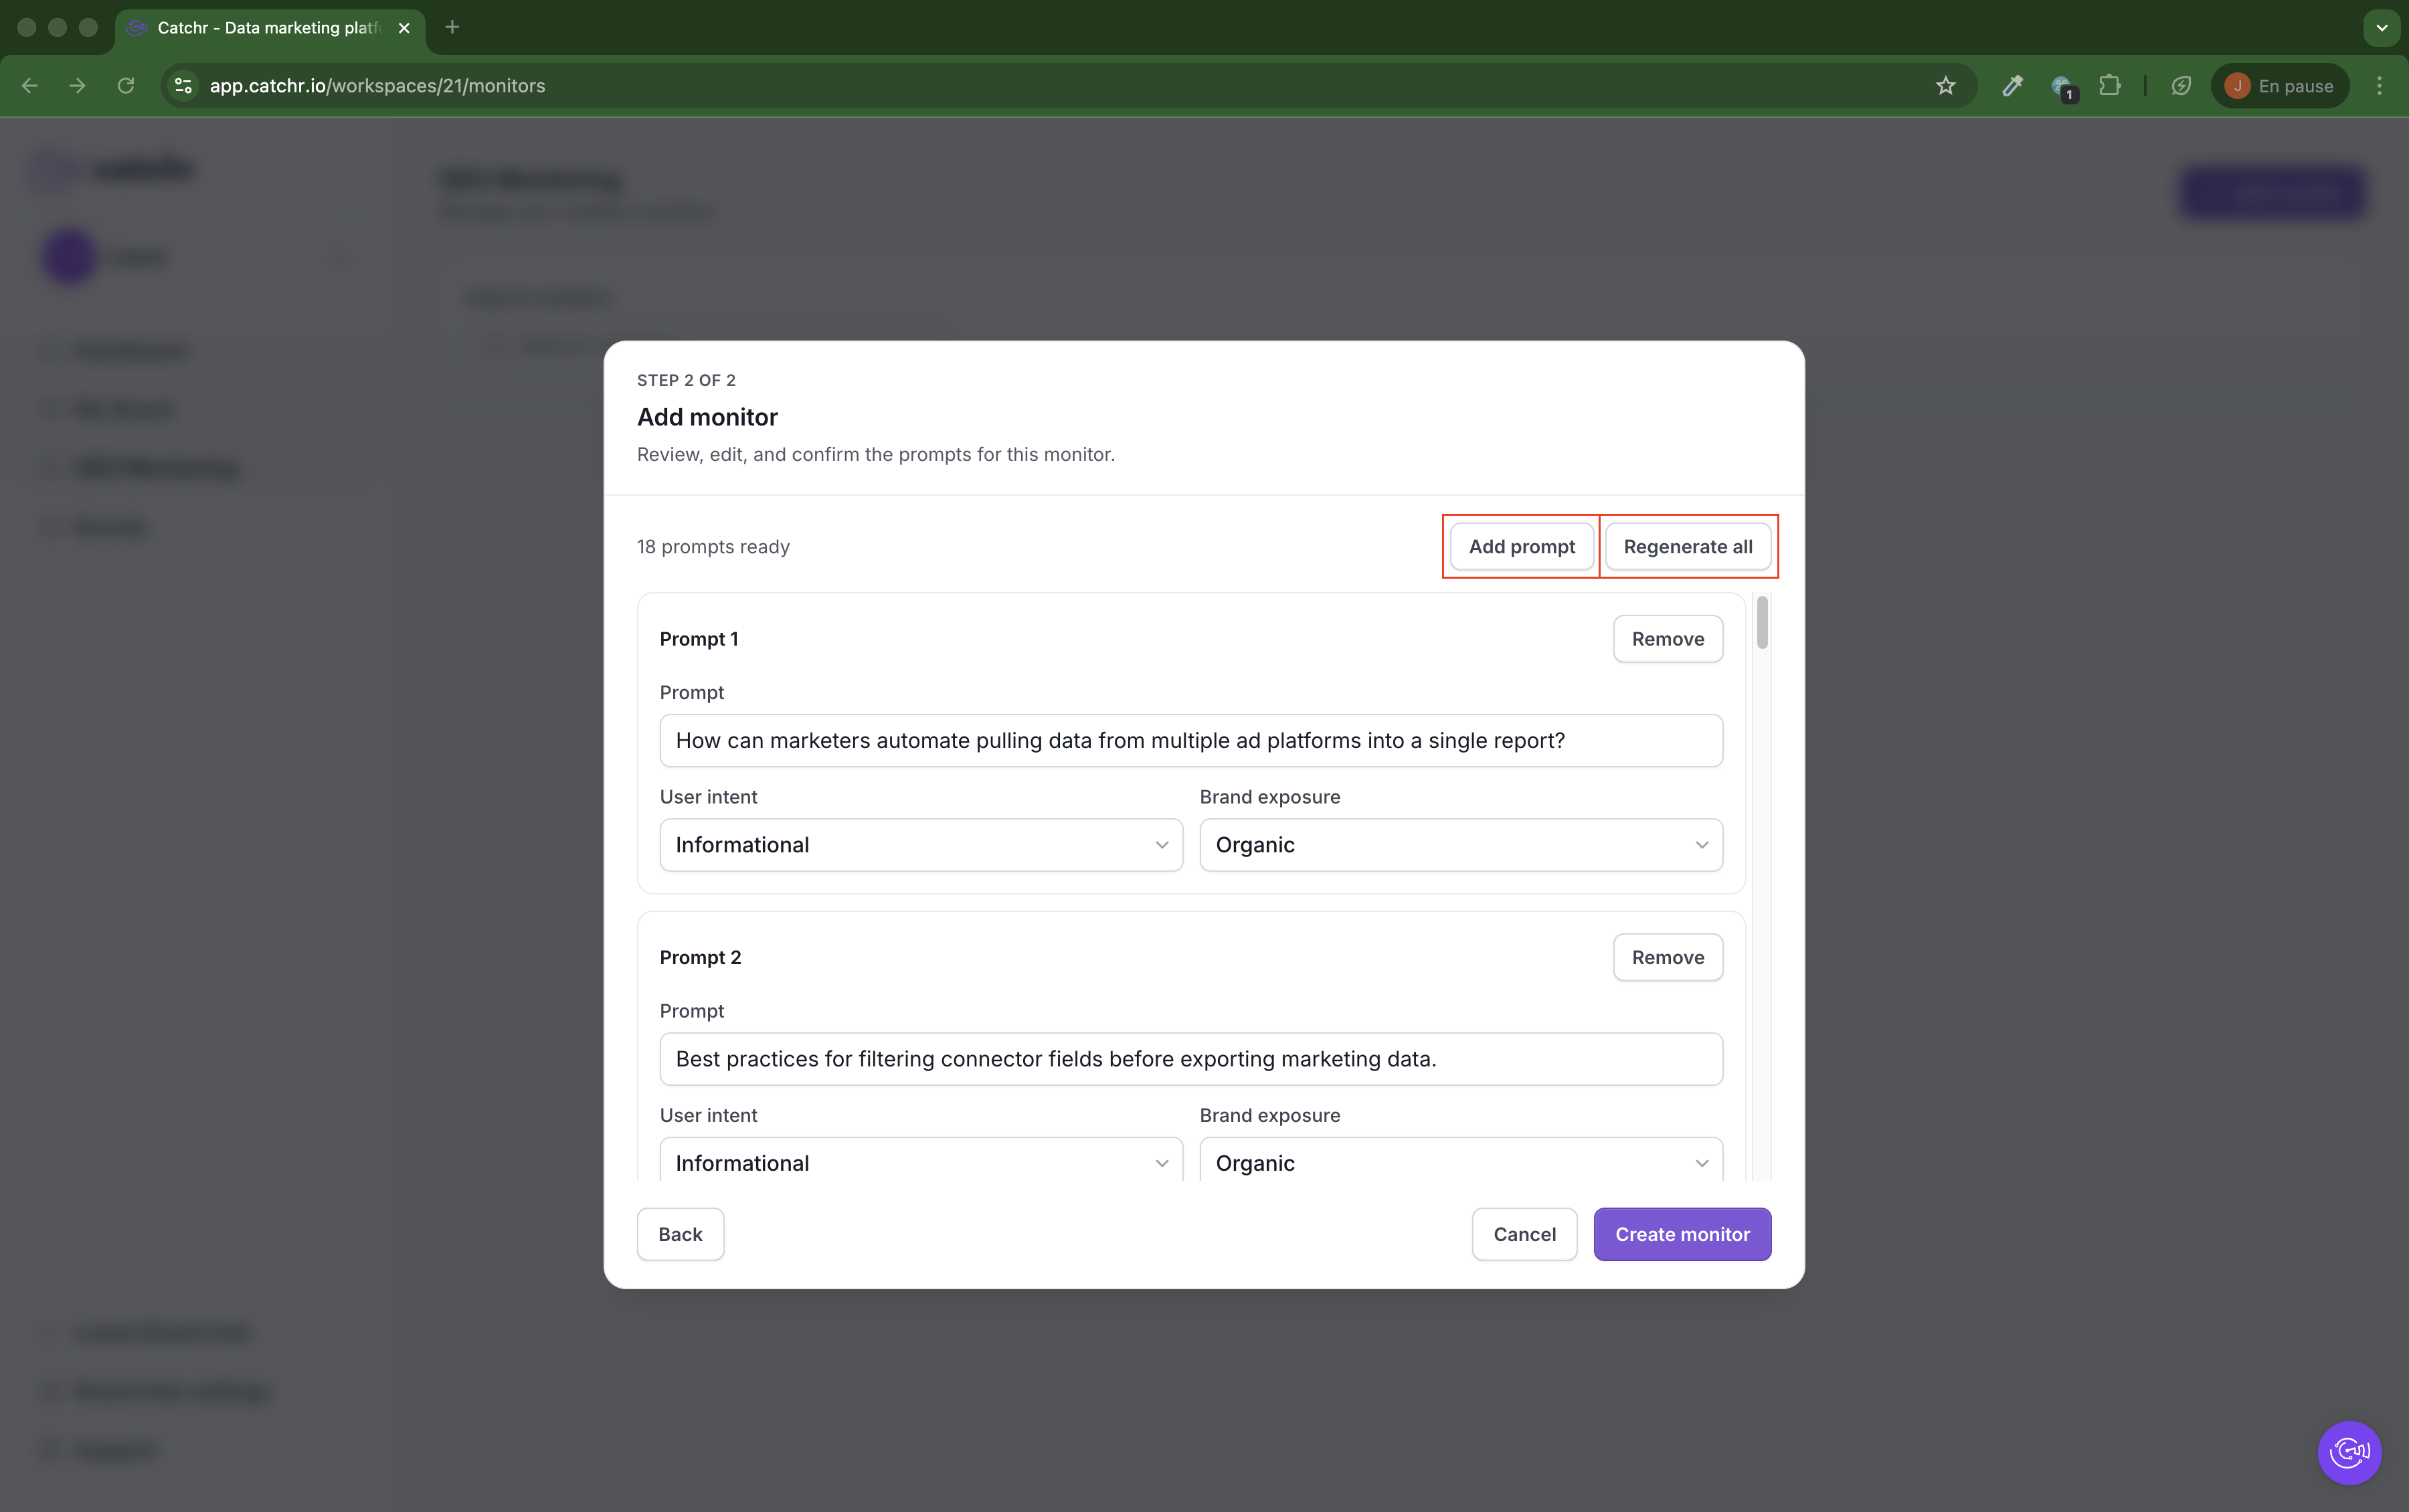
You can also:
- Click Add prompt to create a new one manually.
- Click Regenerate all to refresh the full prompt set.
- Click Create monitor when ready.
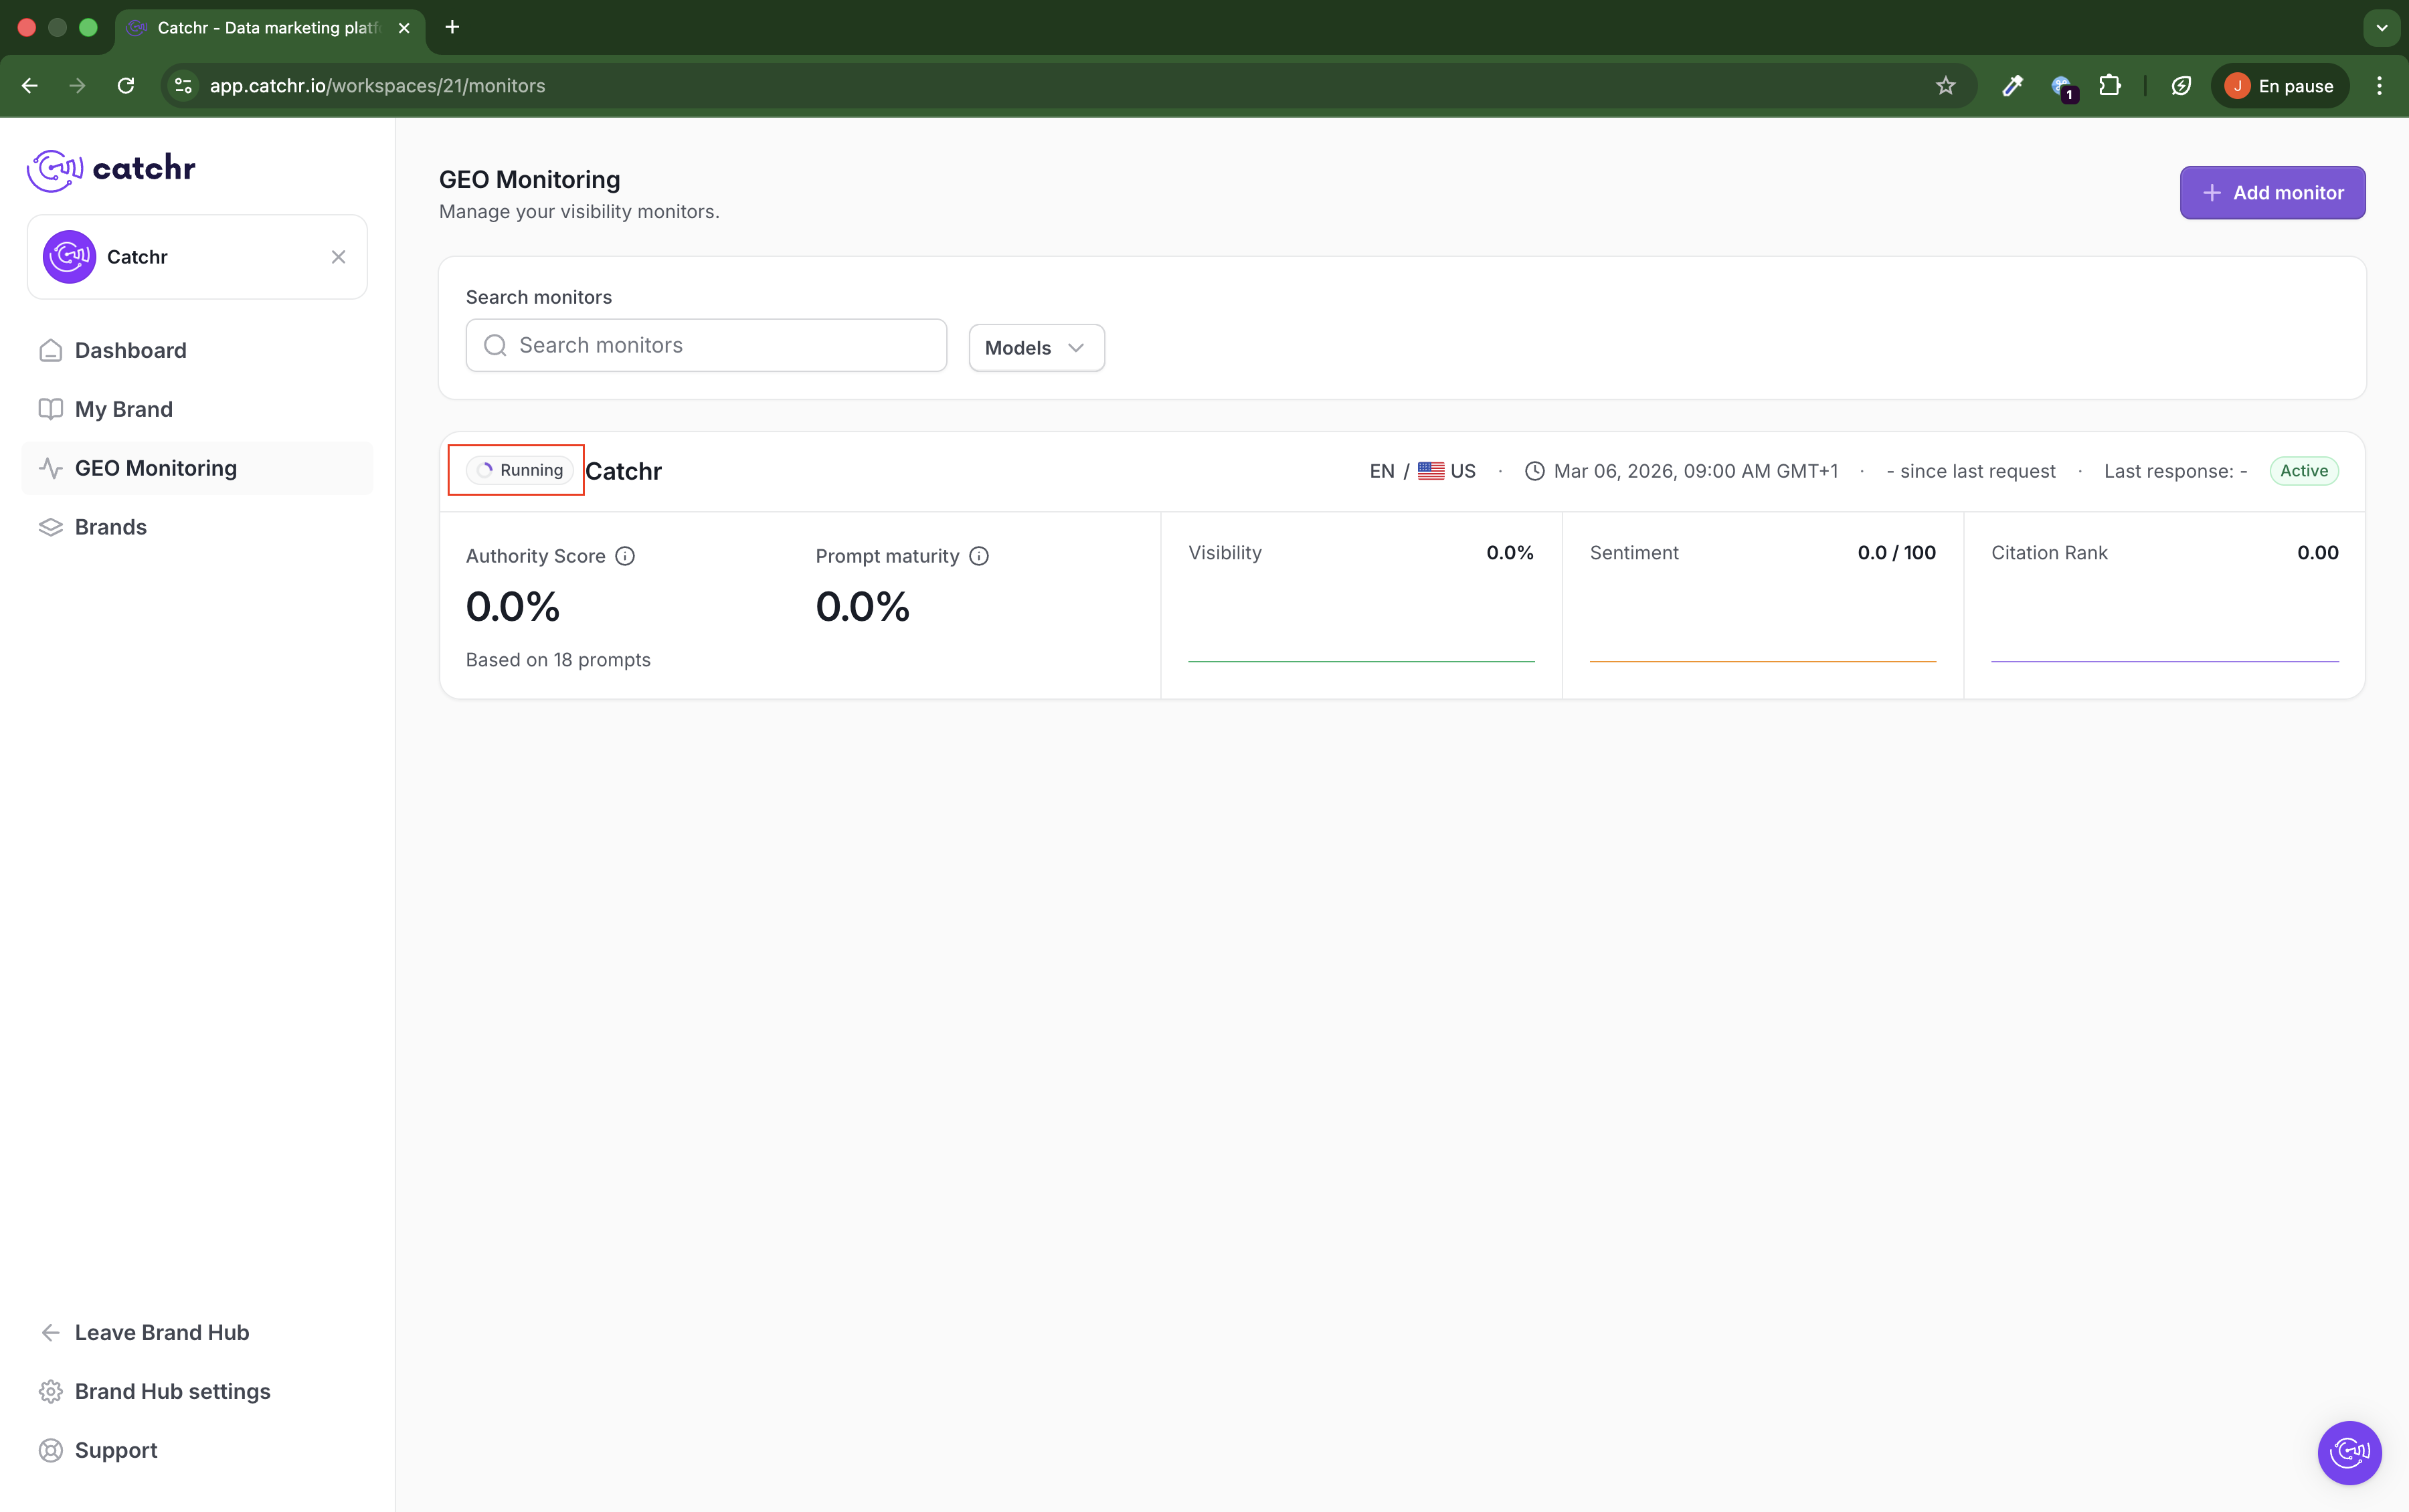
After the monitor is created, GEO starts collecting responses.
During this period, monitor status can show Running and metrics may remain at 0 while data is processing. The first run can take several minutes.
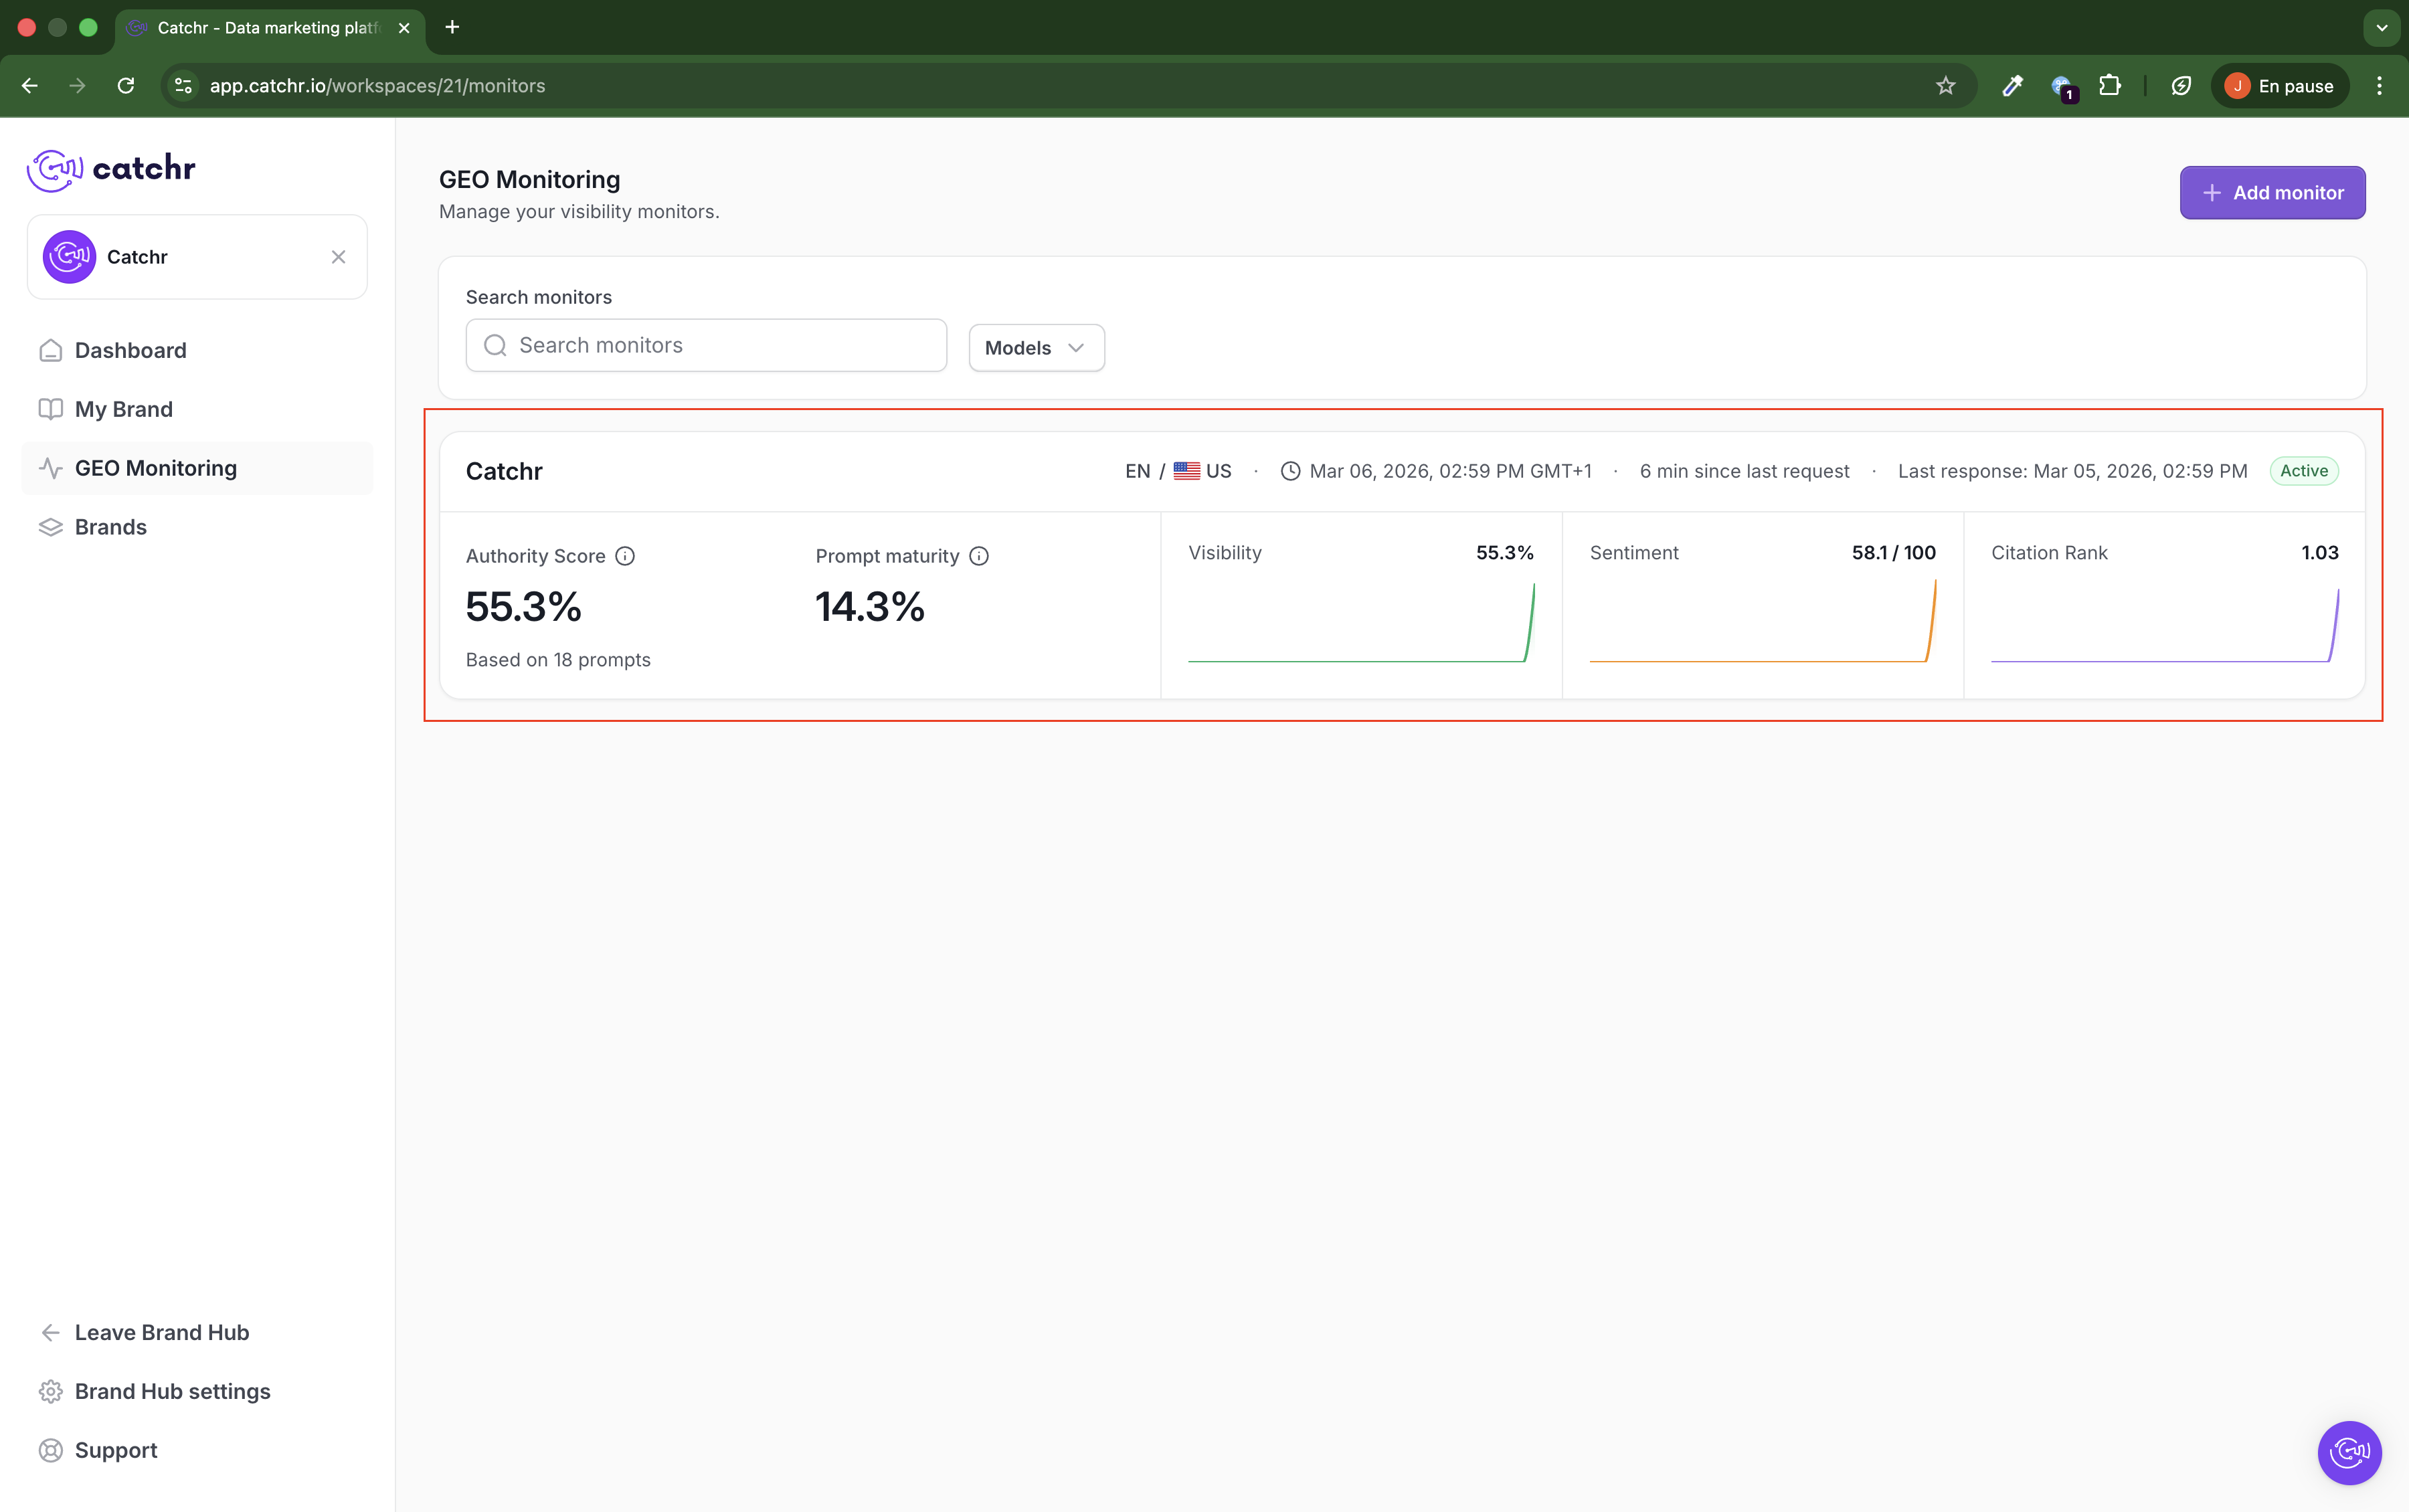
When the run is complete, the monitor card displays global metrics, including:
- Authority Score: an overall score showing how strongly your brand appears across the monitor's tracked prompts.
- Prompt maturity: a score showing how complete and usable your prompt set is for monitoring this brand and market.
- Visibility: the share of prompts where your brand appears in model responses.
- Sentiment: the overall tone of model responses about your brand, from negative to positive.
- Citation Rank: a score showing how often your brand is cited or referenced compared with other mentioned sources or brands.
You also see context metadata (language/country, last request time, last response time, active status).
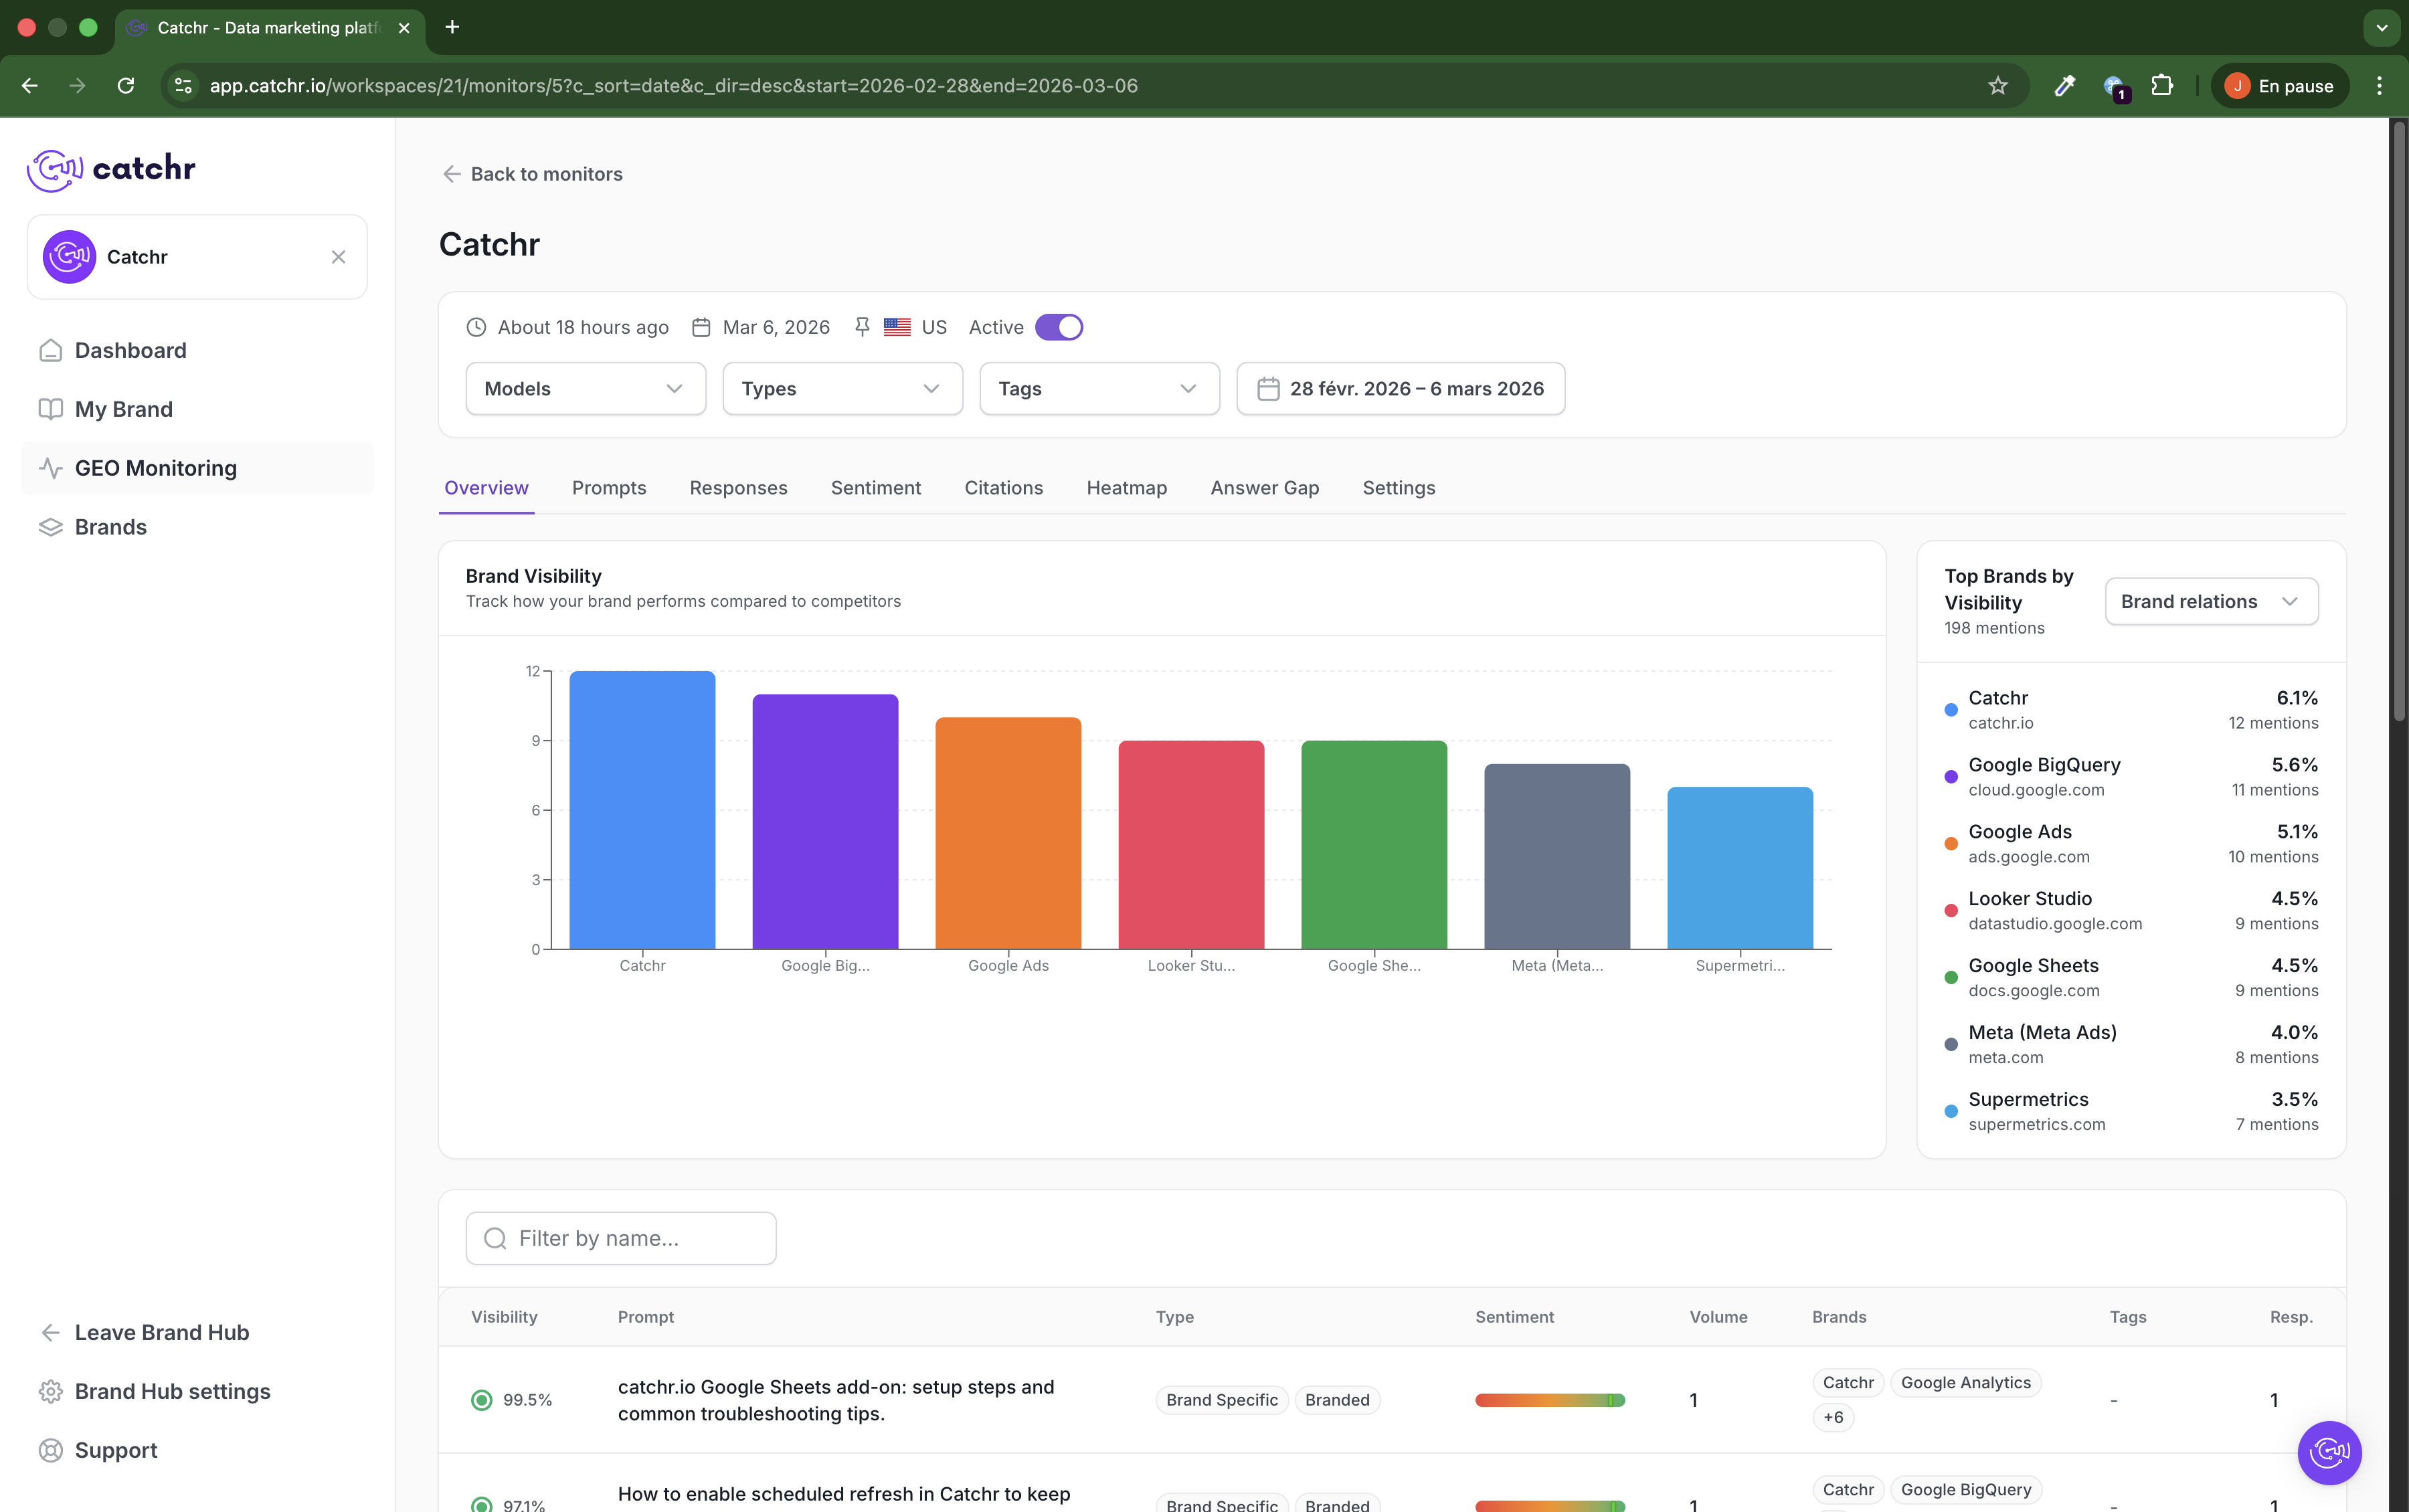
Click a monitor card to open its detail page. The Overview tab gives you a high-level summary of how your brand performs across the monitor.
At the top of the page, you can review and adjust the monitor context:
- Last update time: shows when the monitor was last refreshed.
- Date: shows the current reporting day or selected period context.
- Country: confirms the market this monitor is tracking.
- Active toggle: lets you see whether the monitor is currently active.
- Filters: use Models, Types, Tags, and the Date range picker to refine the data shown on the page.
In the main content area, the Brand Visibility chart shows how often your brand and other brands appear across monitored responses. This helps you compare your visibility against competitors or related brands in the selected scope.
On the right, Top Brands by Visibility ranks the brands most frequently mentioned in monitored responses. Each row shows:
- The brand name
- Its associated domain
- Its visibility percentage
- Its number of mentions
Below the chart, the summary table helps you connect overview metrics to individual prompts. Depending on the applied filters, it shows prompt-level rows with key fields such as:
- Visibility
- Prompt
- Type
- Sentiment
- Volume
- Brands
- Tags
- Resp.
Use this page when you want a quick monitor-level summary before opening the more detailed tabs in GEO.
- Empty state: no monitor exists yet, CTA to create one.
- Loading/Running state: first run in progress, partial or zero metrics.
- Active state: latest stats available, monitor is updating on schedule.
- Navigation basic: click a monitor card to open details, use Back to monitors to return.
- Wait a few more minutes and refresh the page.
- Check that monitor status is not still Running.
- Confirm your monitor has prompts and at least one selected model.